• Skip to main content
  • Skip to primary sidebar

NMR Testing Laboratory

Industrial NMR Spectroscopy Applications

  • Home
  • About Us
    • About Process NMR
    • Our History
    • Facilities
    • Applications
    • Chemometrics
    • News and Events
  • Services
    • Price List
    • Submission Form
    • Liquid NMR
    • Solid NMR
    • Benchtop NMR
    • Consulting
    • Automated Applications
    • Expert Witness
  • Expertise
    • CV
    • Presentations
    • Reviews and White Papers
  • Blog
  • Contact
You are here: Home / Archives for Process NMR

The Power of MestReNova Data Processing and Analysis Applied to 60 MHz 1H NMR Real Time Reaction Monitoring

May 14, 2012 by process nmr NMR, Process NMR, Reaction Monitoring, TD-NMR

The data analysis capabilities of the MestReNova NMR software makes processing and analyzing complex reaction mixture data a snap! Stacked plots are quick and easy and the integration routines rapidly process the peak areas into reaction profiles. Further steps allow the exponential fitting of the reaction profiles to yield kinetic information. Here are a few examples of the data visualization and rapid reaction profiling on a 60 MHz 1H NMR series obtained every 10 seconds (1 pulse) over the course of 25 minutes – the reaction is the esterification of tert-butanol with acetic anhydride in the presence of acid.

1H NMR Superimposed Plot  - Reaction Monitoring
Figure 1: Stacked Plot of the Aliphatic Region of the Spectrum with Reaction Chemistry Protons Identified

Stacked Plot - 1H NMR Spectra - Reaction Monitoring
Figure 2: Stacked Plot – Full Spectrum – Reaction Monitoring – 146 Spectra – 10 Seconds Apart

Stacked and Angled Stacked Plot - 1H NMR - Reaction Monitoring
Figure 3: Angled Stack Plot – Acetic Anhydride and tert-Butanol – Real Time Reaction Monitoring by 1H NMR at 60 MHz

Whitewashed Stacked Plot - 1H NMR Spectra - Aliphatic Region - Reaction Monitoring
Figure 4: Stacked and Whitewashed Plot of 1H NMR data at 60 MHz – Real Time Reaction Monitoring of Acetic Anhydride with tert-Butanol

Integrated Stacked Plot with Reaction Profiles Obtained from MNova Data Analysis
Figure 5: Data Analysis Tool and production of reaction profiles.

The MNova data analysis tools allow the user to integrate NMR reaction peaks and automatically plots and fits them to exponential time constants allowing detailed kinetics to be extracted rapidly and easily from the data. What used to take hours of lining up ascii spectra in excel or other software now literally takes seconds. The integration is segmented in such a manner that integrals can be made to track with shifting resonances, for example labile protons effected by pH.

The AspectItalia 60 MHz NMR system allows real time analysis of reactions with high S/N on single pulses. half height linewidths of 1-2 Hz (15-30 ppb) are possible on static reaction setups and 2-5 Hz (30 – 80 ppb) are possible with flowing reactions at rates of 1-20 ml/min.

The MNova software is becoming a standard NMR processing platform with many users worldwide. Fully functioning demos can be downloaded from the MestReLab research site at: http://mestrelab.com/software/mnova-nmr/

For further details contact John Edwards

Cryogen-Free NMR – High Resolution Permanent Magnet Systems – The Market Hots Up

May 4, 2012 by process nmr Chemistry, NMR, Process NMR

It is interesting times in the world of NMR – there are a number of new permanent magnet NMR systems hitting the market. I have seen a number of announcements appearing on LinkedIn and other sites in recent days and then there was a question asked about Cryogen-free NMR systems on the AMMRL server. There is a little confusion out there about who is doing what and what these newer NMR systems are capable of. We (Process NMR Associates and Aspect Italia) have been in the market with a high resolution 60 MHz system (3, 5, or 10mm sample tube) since 1997. Anasazi Instruments have been quitely selling hundreds of 60 and 90 MHz FT-NMR systems based on refurbished or newly manufactured Varian EM-360 and EM-390. New to the scene and making a splash with their marketing campaigns are Picospin (300 micron sample tube, 45 Mhz), Nanalysis (3, 5mm sample tube, 60 MHz). Finally, there is a system from Magritek/ACT (5mm sample tube, 42.5 MHz) that has been re-packaged and is now out there in the world. These systems all produce spectra and can be used in the traditional manner that current supercon systems are utilized. Time-Domain (TD) NMR systems should not be confused with these platforms – TD-NMR spectrometer manufacturers include Cosa-Xentaur, Bruker, Oxford Instruments, SpinLock, MR-Resources – which are used typically for hydrogen content, rheology, simple phase measurements (solid fat, water in oil, oil in water, porosity measurements utilizing relaxation analysis.

For the past 17 years we have been actively developing applications for permanent magnet systems shimmed to approximately 3 Hz at peak half height. The new magnet designs are robust and readily shims to 1-2 Hz at half height using 5 or 3 mm NMR tubes. 3 Hz at half height is possible for 10 mm NMR tubes. In the past the focus was in on-line applications in refining and petrochemical and lab systems were not actively marketed. With the third generation of NMR instrument it is time for these robust, non-cryogen, permanent magnet systems to be applied in laboratory and general quality testing applications.

In our laboratory we have an application development advantage in that we have high field 300 MHz NMR systems that are active in commercial NMR analysis and in high field method development. We also have ESR, FTIR-ATR, GC, moisture measurements, and other instruments that we can bring to bear on applications. We can readily develop 60 MHz applications using the 300 MHz NMR data as the basis set to provide primary parameters for analysis or to answer questions about the spectral overlaps that inevitably occur in 60 MHz data sets where 1 ppm on the spectrum axis represents only 60 Hz rather than 300 Hz. When a high field NMR spectroscopist observes a data comparison of spectra obtained at 60 MHz to the same spectrum obtained at 300 MHz (a resolution that most are familiar with) the penny suddenly drops concerning the possibilities that exist for NMR analysis at this field and an appreciation for the work that was performed for the first 30 years of NMR technology on 40 and 60 MHz CW NMR’s. We have become accustomed to our big supercon magnets and have forgotten what can be accomplished at 60 MHz. In these days of powerful computers for multivariate analysis and the ability ot perform global spectral deconvolution (GSD) the ability to develop killer-apps for bench-top, at-line, or in-line applications of 1H/31P/19F/23Na/11B NMR for 110V powered systems is here. The application of chemometrics and GSD at 60 MHz can allow the lower resolution issue of peak overlap to be overcome.

Comparing spectra obtained on our 300 MHz systems to the same samples on the 60 Mhz systems. Direct comparisons of the data make you realize that though the resolution isn’t anywhere near the same – the information is present in the 60 MHz spectrum. In the links below I have included a number of PDFs showing comparisons of complex essential oil spectra, fish oil and vegetable oils (looking at omega-3 fatty acid content), polyurethane adhesive polymers, shale oil, gasoline and a spectrum of Poloxamer which is a oxyethylene-oxypropylene copolymer utilized in the pharmaceutical industry that has an NMR based USP/NF method associated with it to determine the oxyethylene content.

Polyurethane Polymers – 60 MHz vs 300 MHz – PDF

Essential Oils – 60 MHz vs 300 MHz – PDF

Fish Oils and Seed Oils – Omega-3 Content – 60 MHz vs 300 MHz – PDF

Poloxamer Analysis – Shale Oil and Gasoline Analysis – 60 MHz vs 300 MHz – PD

Process NMR is actively involved in development of NMR applications utilizing 60 MHz or 300 MHz NMR data. We can develop applications for you and also provide the robust, proven instrumentation that can make affordable, cryogen-free NMR analysis a common automated laboratory tool. We are also looking to prove the utility of this excellent technology in all industrial sectors – if you have an application and would like to see a feasibility study we would be happy to provide such an opportunity. We have NMR systems looking for things to do! Please contact us if you feel you have an application where NMR may provide an answer through direct measurement or chemometric calibration. We are also interested in developing multi-spectroscopy technique data fusion applications where NMR and IR are combined to provide “better answers”.

1H NMR – 60 MHz Permanent Magnet System – Reaction Monitoring

January 18, 2012 by process nmr NMR, PAT, Process NMR

Below are a few further examples of acetylation reactions of acetic anhydride with an excess of alcohol. The alcohols include tert-butanol and isopropanol.

Reaction 1: Acetylation of t-butyl alcohol with acetic anhydride in the presence of acid.

Acetylation of t-butanol with acetic anhydride - 1H NMR Reaction Monitoring

Reaction 2: Acetylation of Isopropanol with acetic anhydride in the presence of acid.

Acetylation of isopropanol with acetic anhydride - 1H NMR Reaction Monitoring

Reaction 3: Methoxyacetone and hydroxylamine reaction in methanol to form an Oxime

Oxime Production from Ketone and Hydroxylamine - 1H NMR Reaction Monitoring

Oxime Production from Ketone and Hydroxylamine - Zoomed spectrum - 1H NMR Reaction Monitoring

Resolution of the methylenes in the methoxyacetone and the reaction product is readily observed.

Oxime from ketone and hydroxylamine - assignment - 1H NMR Reaction Monitoring

All the above experiments were performed in an NMR tube. We are currently looking at the same reactions under flow conditions utilizing a HPLC pump and PEEK tubing to transport sample to the NMR probe at 5 ml/min.

Chevron Installs Low Field NMR Application: 31P NMR Analysis of Phosphoric Acid Strength in Alkylation Process

January 2, 2012 by process nmr NMR, PAT, Process NMR

New Flash: Chevron purchases high resolution 31P NMR system for at-line analysis of a phosphoric acid catalyzed alkylation process.

The Chevron Richmond Refinery needed a simple and quick measurement of phosphoric acid strength and quality. Prior analysis procedures included transporting samples several miles from the refinery process to the technical center in order to perform the 31P NMR analysis on a high field superconducting NMR system. This process was also complicated by the fact that the process operators were not able to perform the analyses on the conventional high field NMR systems (400 MHz for 1H, 161 MHz for 31P) themselves, but had to wait for NMR technician and instrument availability. If sample analyses was required after research facility working hours the NMR lab technicians were required to come in and run the NMR for the process operators.

A simple permanent magnet bench-top NMR system has now been placed in the existing process lab adjacent to the process unit control room. The NMR samples are placed in specially designed 9 mm (diameter) x 50 mm (length) sample tubes in order to accommodate sample handling issues (high viscosity sample with no solvents being added) and are place easily into the NMR probe. Sample preparation is essentially non-existent and sample waste is minimal. The 31P NMR analysis itself takes around 3 minutes to perform.

The “at-line” NMR system is a high resolution Qualion permanent magnet system operating at 58.3 MHz for 1H and 24.2 MHz for 31P. The system is located on a lab bench in the process lab building. Some examples of the system performance are shown along with the comparison with high field NMR results. It can be seen that the lower field instrument provides more than adequate resolution to perform the acid strength analysis.

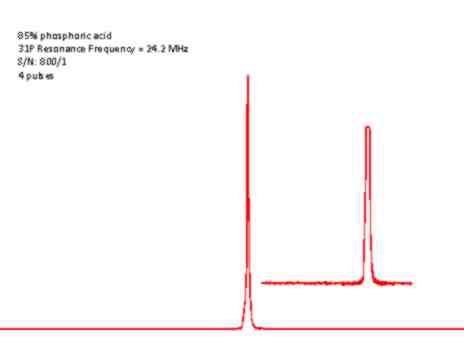
31P NMR - Orthophosphoric Acid

Figure 1: 31P NMR of 85% Phosphoric Acid

Figures 1 and 2 show quantitative 31P NMR spectra of different phosphoric acid concentrations dissolved in water. The NMR analysis is found to be fully quantitative.

31P NMR of Different Concentrations of H3PO4 in Water - At-Line NMR

Figure 2: 31P NMR signal acquired at 24.2 MHz on several concentrations of phosphoric acid in water.

Figure 3 shows the 31P NMR data obtained at 7 Tesla (121 MHz) and 1.4 Tesla (24.2 MHz) of actual process samples. The peak at 0 ppm corresponds to orthophosphoric acid, the peak at -15 ppm corresponds to the terminal P atoms of a polyphosphoric acid chain, and the peak at -30 ppm corresponds to internal P atoms in the middle of polyphosphoric acid chains. Relative areas of these peaks are used to calculate the acid strength.

31P NMR - Phosphoric Acid Strength - At-Line Assay

Figure 3: High field and low field 31P NMR spectra of Used Phosphoric Acid from Alkylation Process

Used Phosphoric Acid - At-Line 31P NMR Analysis

Figure 4: 31P NMR spectra and calculated acid strengths obtained on 3 different used phosphoric acid samples

Used Phosphoric Acid - At-Line 31P NMR - Acid Strength Assay

Figure 5: Another comparison of 7 Tesla laboratory acquired NMR data compared to rapid at-line 1.4 Tesla NMR assay of phosphoric acid strength.

The NMR system being utilized at the Chevron Richmond refinery is a Qualion 60 MHz NMR system utilizing a 31P probe.

For further details or to discuss your own NMR applications please contact Paul Giammatteo (Tel: +1 203-744-5905)

A Review of Applications of NMR Spectroscopy in the Petroleum Industry

December 21, 2011 by process nmr Energy, NMR, Process NMR, TD-NMR

John Edwards, principal of Process NMR Associates has authored a chapter entitled “A Review of Applications of NMR Spectroscopy in the Petroleum Industry” which appears in a new ASTM publication: Monograph 9 – Spectroscopic Analysis of Petroleum Products and Lubricants, Edited by Kishore Nadkarni. The chapter describes the application of high resolution 1H and 13C NMR, 1H TD-NMR, and solid-state NMR to petroleum chemistry and refining.

Monograph 9: Spectroscopic Analysis of Petroleum Products and Lubricants

The book can be ordered at the ASTM Bookstore.

  • « Go to Previous Page
  • Page 1
  • Interim pages omitted …
  • Page 3
  • Page 4
  • Page 5
  • Page 6
  • Page 7
  • Interim pages omitted …
  • Page 11
  • Go to Next Page »

Primary Sidebar

  • Home
  • About Us
    • About Process NMR
    • Our History
    • Facilities
    • Applications
    • Chemometrics
    • News and Events
  • Services
    • Price List
    • Submission Form
    • Liquid NMR
    • Solid NMR
    • Benchtop NMR
    • Consulting
    • Automated Applications
    • Expert Witness
  • Expertise
    • CV
    • Presentations
    • Reviews and White Papers
  • Blog
  • Contact

Categories

  • Beer
  • Benchtop NMR
  • Chemistry
  • Chemometrics
  • Cider
  • Craft Beverage
  • Energy
  • ESR
  • Herbal Supplement
  • IR-ATR
  • NIR
  • NMR
  • NMR Test Methods
  • NMR Validation
  • PAT
  • Petroleum
  • Process NMR
  • qNMR
  • Reaction Monitoring
  • TD-NMR
  • Uncategorized

Meta

  • Log in
  • Entries feed
  • Comments feed
  • WordPress.org

Follow Us

Follow us on social media to stay on track with the latest news.

Twitter
Facebook
RSS

Search

Blogroll

  • Carlos' NMR Software Blog
  • Mestrelab Blog – NMR Data Processing Software
  • NMR Wiki
  • Stan's NMR Blog
  • University of Ottawa – NMR Facility Blog
  • Home
  • About Us
  • Services
  • Expertise
  • Blog
  • Contact

Copyright © 2025 · Process NMR · All Rights Reserved.
Handcrafted with by Studiodog Group