• Skip to main content
  • Skip to primary sidebar

NMR Testing Laboratory

Industrial NMR Spectroscopy Applications

  • Home
  • About Us
    • About Process NMR
    • Our History
    • Facilities
    • Applications
    • Chemometrics
    • News and Events
  • Services
    • Price List
    • Submission Form
    • Liquid NMR
    • Solid NMR
    • Benchtop NMR
    • Consulting
    • Automated Applications
    • Expert Witness
  • Expertise
    • CV
    • Presentations
    • Reviews and White Papers
  • Blog
  • Contact
You are here: Home / Archives for Chemistry

The Chemical Fingerprint of Beer from a Single Experiment with Minimum Sample Preparation – A Rapid Quantitive Analysis by 1H NMR Spectroscopy

September 7, 2016 by process nmr Beer, Benchtop NMR, Chemistry, Cider, Craft Beverage, NMR, NMR Test Methods, NMR Validation, qNMR Tagged: Beer, Ethanol, Fingerprint, Malt, NMR, Organic Acid, Quality

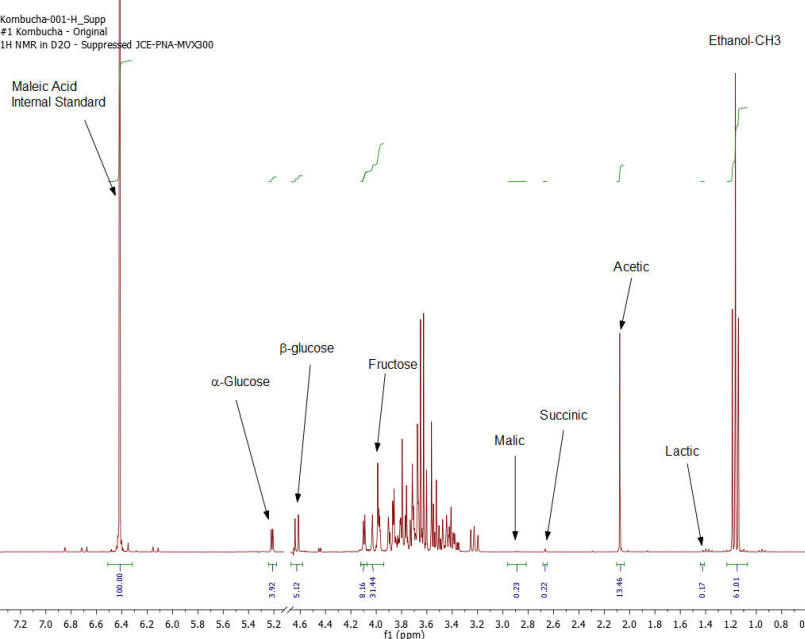
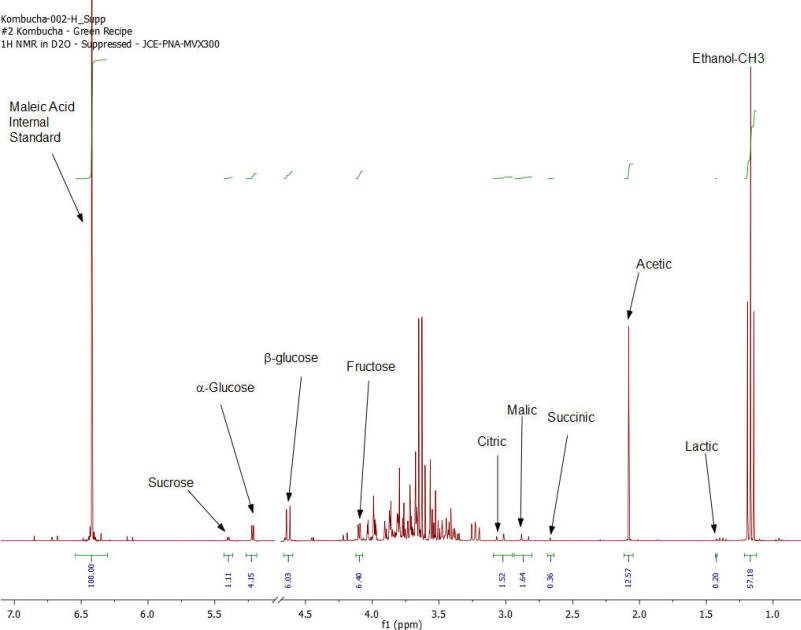
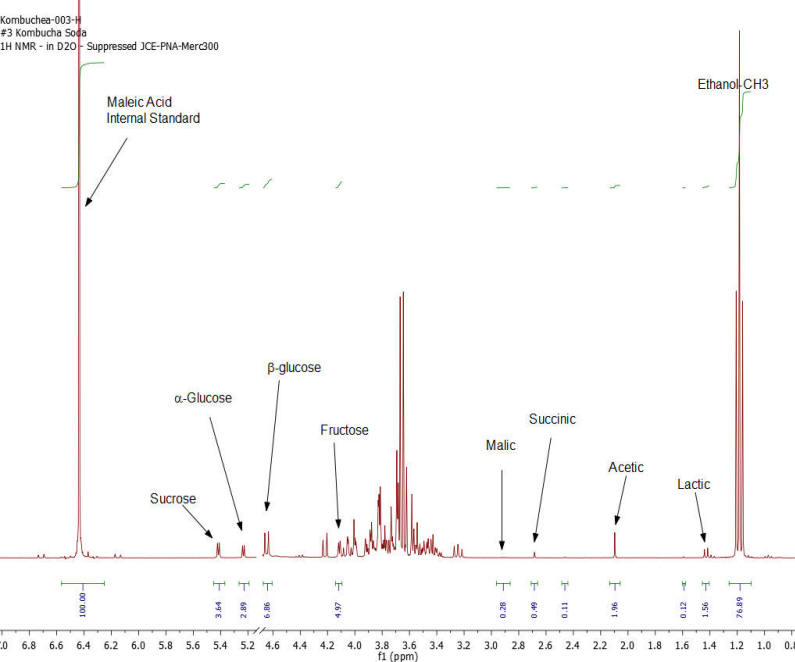
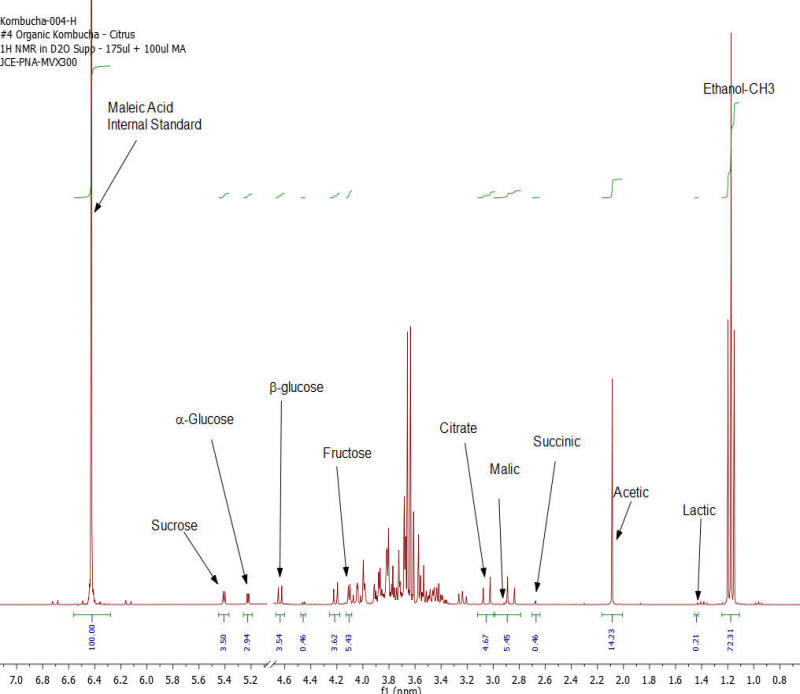
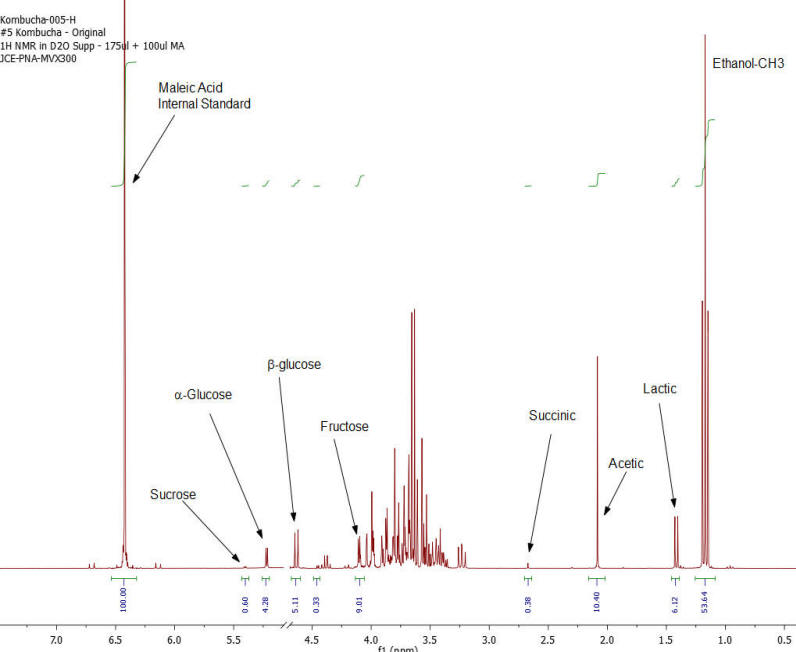
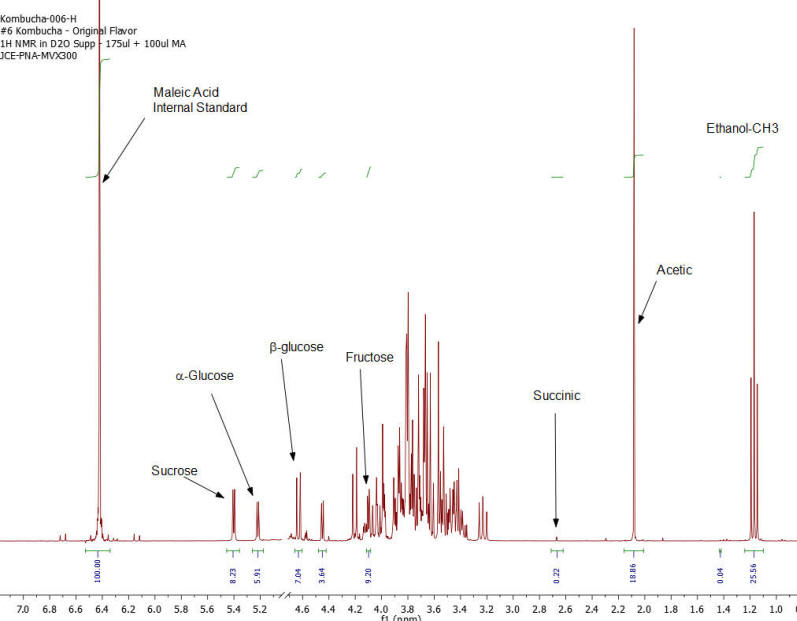
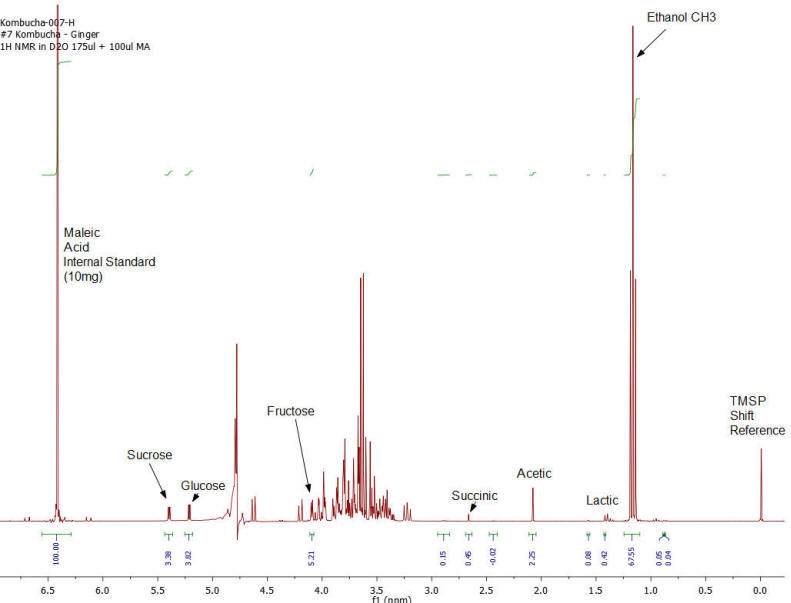
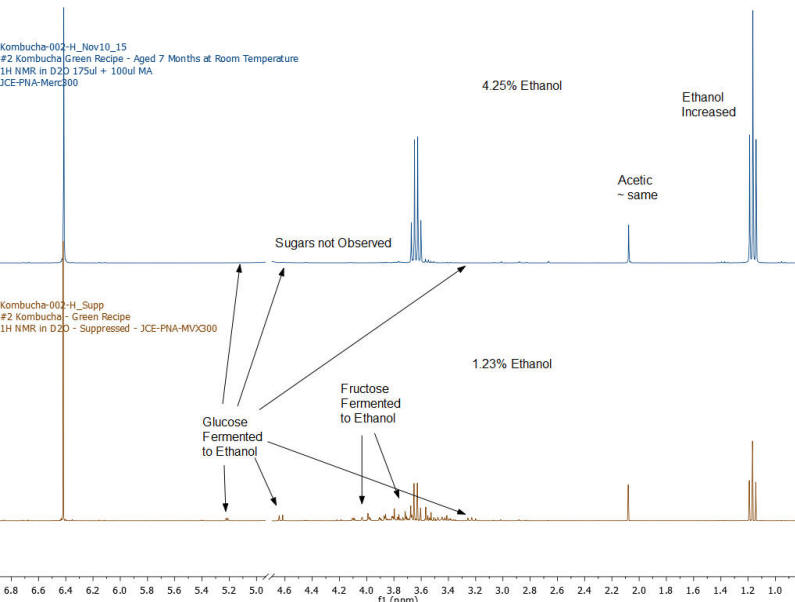
NMR Spectroscopy is the premier tool utilized by chemists to obtain detailed chemical information on molecular structure and is used extensively in molecular structure verification, chemical purity analysis, and complex mixture analysis. We have developed a quantitative NMR analysis that yields a chemical fingerprint that brewers can utilize to follow detailed variations in the chemistry observed in the various stages of the brewing process (malting, mashing, boiling, fermentation, ageing, and blending). The analysis observes all molecules in the beer at the same time and each molecular component (acids, alcohols, amino acids, malt-oligosaccharides) yields a unique spectral fingerprint pattern that is related to the structure of the molecule. Though the spectrum consists of a large number of overlapped individual fingerprints it is possible to identify and quantify individual components because many components have signals that appear at unique and specific points in the spectrum. The quantitative analysis is performed by comparing the area under the individual molecule signals to that of an internal standard (Maleic Acid 99%). Molecular components are quantified on a weight/volume basis in mg/L (parts-per million). Ethanol is also quantified on a %volume/volume basis.

The technique is not only applicable to the brewing process but is also being utilized to gain detailed chemical understanding of cider-making process, as well as the production of wine, mead, sake, spirits, and kombucha. Our laboratory has been developing this method with the help of a number of breweries following changes in batches of standard beers (Kolsch, Stout, Scots Ale, Barley Wine) as the brewing process is tweaked and changed over the course of 2 years. We have looked not just at finished beers but have studied dextrin solubility and chemistry of wort made from different malts, the effect of temperature on sour mashing, the effect of wild yeast and bacteria on various aspects of beer chemistry, as well as troubleshooting of “out of sensory target range” beers. The analysis requires very little sample preparation, has a large (orders of magnitude) linear concentration range of applicability and observes a large number of components in a single test that does not require constant re-calibration with expensive standards.

A poster was presented on this topic at the World Brewing Congress held August 1-17 in Denver Colorado – the poster can be downloaded here.

Quantitative 1H NMR Analysis of “Off-the-Shelf” Commercial Kombucha Beverages for Ethanol, Organic Acids and Residual Sugars Analysis

December 28, 2015 by process nmr Beer, Chemistry, Craft Beverage, NMR, NMR Test Methods, NMR Validation, qNMR Tagged: Ethanol, Kombucha, NMR, Organic Acid

Over the past few years our analytical NMR service has been developing a detailed chemical fingerprint analysis of alcoholic beverages by quantitative 1H NMR (qHNMR). Beyond the typical analyses of beer, wine, port, hard cider, sake and spirits, we have been looking at other fermented beverages such as kombucha, kefir, kvass, mead, ginger beer and perry. As well as the final fermented beverages we have been actively investigating the various starting materials such as malt wort, apple juice, honey, grape juice, fruit juices, and tea. The NMR analysis can provide a rapid quantitative analysis without any sample preparation based on the molar ratio of integration value of unique molecular fingerprint peaks with the integrated signal of an internal standard. In our case we typically use maleic acid as an internal standard as it’s singlet signal peak appears in a non-overlapping are of the spectrum to the chemistry we are interested in following.

The information that can be derived from the NMR experiment covers a wide dynamic range of component molecule concentrations from 10-100,000 ppm. The analysis observes all fully dissolved chemical constituents and the spectral response is linear with regard to all chemical types. As a primary analytical method the chemist can utilize the well understood literature on the NMR chemical shifts and couplings that allow first principles analysis of each molecular fingerprint to identify and quantify the presence of targeted and non-targeted molecules in the complex mixture. The analysis provides quantitative information on the following chemical components: ethanol, higher (C3,C4,C5) alcohols, methanol, glycerol, organic acids (lactic, acetic, succinic, pyruvic, pyruvic hydrate, citric, malic, tartaric, quinic), free amino acids (alanine, isoleucine, valine, tyrosine, phenylalanine), carbohydrates (sucrose, glucose, fructose, sorbitol, xylose, galacuronic acid, maltose, 1,6- and 1,4-dextrin chemistry, maltotriose, lactose), polyphenols. It can also provide information on yeast metabolism products such as 2,3-butandiol (directly from Enterobacter or from the action of saccharomyces on diacetal which is a well-known beer flavor deviation), 1,3-propandiol (from yeast action on glycerol after carbohydrates have been entirely fermented from the beverage).

In recent years kombucha has been found to contain more than 0.5% v/v ethanol which would technically lead the product to be classified as alcoholic beverages and bring the product under scrutiny and taxation by the Alcohol and Tobacco Tax and Trade Bureau which federally regulates the alcoholic beverage industry. Kombucha is a sweetened black or green tea that has been inoculated with a symbiotic culture of bacteria and yeast (SCOBY) which ferments the sugars in the drink solution in bith the manufacturing process and in the sealed bottle shipped out to stores. The drink is sold under the premise that the SCOBY provides a probiotic culture to the consumer which means that in many Kombuch products the activity of the culture is not arrested by pasteurization or by addition of sorbate. Thus, the kombucha is bottled with active yeast and bacteria present in a high sugar containing tea drink. Fermentation is then thought to occur while the product sits on shelves and leads to >0.5% ABV when the drink is purchased or consumed. We have utilized 1H NMR to obtain quantitative ethanol concentrations on a number of kombucha beverages bought off the shelf at grocery stores. The samples we analyzed represent the entire dataset of kombuchas that we purchased and they represent the products of 5 different manufacturers. We also aged two of the products at room temperature for 7 months and analyzed them to observe the effect of long term aging on kombucha products.

Experimental: 1H NMR spectra were acquired on a Varian Mercury-300MVX spectrometer operating at a resonance frequency of 299.67 MHz and equipped with a Varian 5mm ATB PFG probe. The experiments are performed under quantitative conditions utilizing a 10 ms (p/3 tip angle) pulse with an 8 second acquisition time and a 7 second relaxation delay. 64 transients were acquired over a spectral window of 8 kHz at a controlled temperature of 27oC. Water suppression was achieved by pre-saturation and this can affect the quantitation of glucose in the samples under these conditions.

Sample preparation: Samples were purchased “off the shelf” at local grocery stores and were analyzed the same day that they were purchased. Samples were prepared by 1) degassing the samples by repeated vortex agitation, 2) samples are equilibrated at 27oC before pipetting to allow a mass to volume conversion to be utilized to calculate the %ABV utilizing an ethanol density value of 0.7816 kg/L, 3) pipetting 175ml of kombucha beverage into a 5mm NMR tube, 4) adding 100ml of a 100mg/ml solution of maleic acid (99.5% – Sigma Aldrich) in D2O (99.8%D), and 5) addition of 375ml of D2O (99.8%D – Cambridge Isotopes Laboratories). The final samples were thoroughly mixed using a vortex mixer.

Two of the kombucha samples were purchased in duplicate and not opened immediately but stored at room temperature for 7 months before being analyzed. These stored samples were compared with the same samples that were opened and analyzed immediately after purchase.

Calculations: Component concentrations were calculated on a mg/L basis based on a knowledge of the concentration of maleic acid internal standard present in the sample (10mg) using the following equation:

Component Concentration (C) in mg/L = 0.995 x 10 x ((IC/NC)/(IMA/NMA)) x (MC/MMA) x (1,000,000/175)

Where 10 mg is the mass of maleic acid used as the internal standard, IC = integral of the component peak, NC = number of protons represented in the component peak, IMA = integral of maleic acid internal standard, NMA = number of protons represented in the maleic acid integral (2), Mc = molecular weight of the component, MMA = molecular weight of maleic acid (116.1 amu). Other aspects of the equation are – 175ml of sample must be adjusted to 1 liter (1,000,000 ml), and the whole must be multiplied by 0.995 as the maleic acid can only be guaranteed to be 99.5% pure. The ethanol content is calculated based on a weight per volume basis (mg/L) and then a calculation is performed to convert this weight/volume concentration to a volume/volume basis using a density value of 0.7816 kg/L to convert the weight of ethanol to the volume of ethanol.

Results: Figures 1-7 show the 1H NMR spectra of the 7 kombucha samples purchased and analyzed immediately. All 7 samples were found to contain ethanol and only one of them was found to contain less than 0.5%. Figure 8 shows a stacked plot comparison of the chemistry observed in a kombucha that was aged for 7 months at room temperature compared to the sample when it was initially purchased. The alcohol content rose from 1.23 %ABV to 4.25 %ABV and it can be seen that all sugars in the original drink have been consumed by the SCOBY to produce this increased alcohol content. The acetic acid content of the aged drinks also increased but it is obvious that the conversion of ethanol to acetic acid by acetobacteria present in the SCOBY does not offset the overall production of ethanol. The component concentrations of ethanol, sugars and organic acids in each of the kombucha beverages analyzed are provided in Table I.

Table I: Concentration of Chemical Components of Kombucha Beverages

Kombucha Sample
Component #1 #1 Aged #2 #2 Aged #3 #4 #5 #6 #7
Lactic Acid (mg/L) 64 68 131 210 461 124 1809 24 248
Succinic Acid (mg/L) 74 97 116 277 142 134 110 64 131
Acetic Acid (mg/L) 3056 5637 2746 3333 387 2806 2051 3719 444
Malic Acid (mg/L) 175 190 175 190 185 515 0 0 99
Ethanol (mg/L) 10625 12640 9580 33245 11631 10938 8114 3866 10218
Ethanol (v/v) 1.36 1.62 1.23 4.25 1.49 1.40 1.04 0.49 1.31
Sucrose (mg/L) 0 0 4141 0 12261 11790 2021 27723 11386
Glucose (mg/L) 24017 24507 24460 0 15379 15645 22776 31450 20328
Fructose (mg/L) 31786 9433 23725 0 16634 18173 30155 30791 17437
Sorbate (mg/L) 0 0 0 0 0 0 0 0 0
Citrate (mg/L) 0 0 1592 1582 0 4416 0 0 0

Kombucha1_NMR

Figure 1: Kombucha #1 – 1H NMR spectrum – component peaks utilized in calculations indicated.


Kombucha2_NMR

Figure 2: Kombucha #2 – 1H NMR spectrum – component peaks utilized in calculations indicated.

Kombucha3_NMR

Figure 3: Kombucha #3 – 1H NMR spectrum – component peaks utilized in calculations indicated.


Kombucha4_NMR

Figure 4: Kombucha #4 – 1H NMR spectrum – component peaks utilized in calculations indicated.


Kombucha5_NMR

Figure 5: Kombucha #5 – 1H NMR spectrum – component peaks utilized in calculations indicated.


Kombucha6_NMR

Figure 6: Kombucha #6 – 1H NMR spectrum – component peaks utilized in calculations indicated.


Kombucha7_NMR

Figure 7: Kombucha #7 – 1H NMR spectrum – component peaks utilized in calculations indicated.


Kombucha8_NMR

Figure 8: Kombucha #2 – Comparison of original analyzed “fresh kombucha” with same purchase date bottle aged at room temperature for 7 months – 1H NMR spectrum – sugar peaks are consumed by the yeast to produce higher alcohol in the aged sample.


References:

Kombucha General Information: Kombucha 101: Benefits, Brewing, Recipes, Storage, And More – Lisa Williams – HappyHappyVegan.com -visited 4-11-19


Alcohol in Kombucha News Articles:

http://www.cnn.com/2015/12/09/health/kombucha-tea-alcohol-content/index.html – visited 12-13-15

http://www.wsj.com/articles/battle-brews-over-kombucha-teas-1447116607 – Visited 12-13-15


Kombucha Product Information:

Kombucha Brewers International – http://kombuchabrewers.org/ – visited 12-13-15


1H qNMR:

“Universal quantitative NMR analysis of complex natural samples”, G C Simmler, J Napolitano, J B McAlpine, S-N Chen and G F Pauli, Current Opinion in Biotechnology 2014, 25:51–59

“Quantitative H NMR spectroscopy”, S K Bharti, R Roy, Trends in Analytical Chemistry, Vol. 35, 2012

“Validation of quantitative NMR”, F Malz , H Jancke, Journal of Pharmaceutical and Biomedical Analysis 38 (2005) 813–823


1H qNMR Applied to Alcoholic and Non-Alcoholic Beverages

“Quantitative determination of ethanol in cider by 1H NMR spectrometry”, A Zuriarrain , J Zuriarrain , M Villar ,I Berregi, Food Control 50 (2015) 758-762

“Quantitative determination of lactic and acetic acids in cider by 1H NMR spectrometry”, A Zuriarrain, J Zuriarrain, A I Puertas, M Dueñas, I Berregi

“Identification and quantification of the main organic components of vinegars by high resolution 1H NMR” spectroscopy, A Caligiani , D Acquotti , G Palla , V Bocchi, Analytica Chimica Acta 585 (2007) 110–119

“NMR-based metabolomics in wine science”, Y-S Hong, Magn. Reson. Chem. 2011,49, S13–S21

“1H NMR-based metabolomic characterization during green tea (Camellia sinensis) fermentation”, J-E Lee , B-J Lee , J-O Chung , H-J Shin , S-J Lee , C-H Lee ⁎, Y-S Hong, Food Research International 44 (2011) 597–604

“NMR methods for beer characterization and quality control”, J E Rodrigues, A M Gil, Magn. Reson. Chem. 2011, 49, S37–S45

“Metabolomic profiling of Cheonggukjang during fermentation by 1H NMR spectrometry and principal components analysis”, H-K Choi, J-H Yoon , Y-S Kim , D Y Kwon, Process Biochemistry 42 (2007) 263–266

“Quantification of organic acids in beer by nuclear magnetic resonance (NMR)-based methods”, J E A Rodrigues , G L Erny , A S Barros , V I Esteves , T Brandão , A A Ferreira , E Cabrita , A M Gil, Analytica Chimica Acta 674 (2010) 166–175

“Monitoring a commercial fermentation with proton nuclear magnetic resonance spectroscopy with the aid of chemometrics”, S Clark , N W Barnett , M Adams , I B Cook , G A Dyson , G Johnston, Analytica Chimica Acta 563 (2006) 338–345

“Quality control of beer using high-resolution nuclear magnetic resonance spectroscopy and multivariate analysis”, D W Lachenmeier, W Frank, E Humpfer, H Schafer, S Keller, M Mortter, Manfred Spraul, Eur. Food Res. Technol. (2005) 220:215–221

“1H NMR spectroscopy for profiling complex carbohydrate mixtures in non-fractionated beer”, B O. Petersen , M Nilsson , M Bøjstrup , O Hindsgaul , S Meier, Food Chemistry 150 (2014) 65–72.

“Regulatory Control of Energy Drinks Using 1H NMR Spectroscopy”, Y B Monakhova, T Kuballa, H Reusch, K Wegert G Winkler, D W Lachenmeier, Lebensmittelchemie 66, 129–168 (2012)

“Qualitative and Quantitative Control of Honeys Using NMR Spectroscopy and Chemometrics”, M Ohmenhaeuser, Y B Monakhova, T Kuballa, D W Lachenmeier, ISRN Analytical Chemistry Volume 2013, Article ID 825318, “Qualitative and Quantitative Control of Carbonated Cola Beverages Using 1H NMR Spectroscopy” P Maes, Y B Monakhova, and D W Lachenmeier, T Kuballa, H Reusch, J. Agric. Food Chem. 2012, 60, 2778−2784

A PDF Version of this Article can be found here – Kombucha NMR.pdf

Process NMR Associates quantitatively analyzes the component chemistry of craft beverages for consumers or manufacturers – for more information contact John Edwards at +1 (845) 240-1177

1H qNMR of Alcoholic Cider – Analysis of Small Molecule and Residual Sugar Chemistry

June 8, 2015 by process nmr Beer, Benchtop NMR, Chemistry, Cider, NMR, qNMR

1H quantitative NMR (qNMR) has been utilized to assess the the small molecule and carbohydrate chemistry of a number of home-brewed and commercial alcoholic ciders. A quantitative chemistry distribution of the products of the various fermentations that occur in cider making. Malolactic fermentation as well as fermentation by saccharomyces and wild yeasts occur in the cider making process which traditionally occurred without the intentional addition of yeast by the manufacturer. The distribution of small molecules produced by the yeast and bacterial metabolomes at work in the process can yield information of the sensory perception of ciders produced in different ways. An investigation of the residual sugar chemistry of commercial ciders gives some indication of the process of sweetening commercial cider products with sugar additions after fermentation is complete. These typical commercial ciders are very different in chemistry distribution compared to very dry cider styles such as those found in the Basque region of Spain where fermentation is taken to the extreme resulting in complete conversion of sugars to alcohol but also glycerols to 1,3 propandiol. Finally it was decided to determine how much quantitative chemistry information could be obtained from benchtop NMR systems operating in the 60 MHz range. These benchtop NMR systems have a price and cost-of-ownership that would allow small laboratories of manufacturers to think about their use in QA and QC roles.

1H qNMR analysis of molecular components in hard cider – targeted and non-targeted quantitative chemical analysis

Essential Oil Analysis – Comparison of 1H NMR from Benchtop and Supercon NMR Systems

March 8, 2015 by process nmr Benchtop NMR, Chemistry, qNMR

1H NMR shows excellent promise to be utilized in the quality control and authentication of essential oils. In order to ascertain if benchtop NMR systems reveal adequate “1H spectral fingerprints” for this purpose we have run several hundred essential oils at 300 MHz (Varian Mercury-300 MVX by 1H, 13C, COSY, HETCOR, DEPT)  as well as at 82.3 MHz (Picospin 80), 60 MHz (Aspect-60), and 42.5 MHz (Magritek Spinsolve). The results plainly show that the spectrometers all yield similar proton line-widths with the difference in field strength leading to different levels of spectral dispersion and resolution. Though each spectrum is different it can plainly be seen that they all contain the same information with varying degrees of overlap. Chemometric and database comparative methods are being developed to allow identification of various essential oils as well as screening and quantifying different levels of adulteration. The figures below show examples from 6 different essential oils showing spectra obtained from all 4 spectrometers and plotted in the normalized chemical shift scale (ppm) as well as the absolute frequency scale (Hz).EO1 EO2 EO3 EO4 EO5 EO6 EO7 EO8 EO9 EO10 EO11 EO12

Residual Catalytic Cracker – Heavy Petroleum Feedstream Properties from 1H NMR at 43 MHz

February 27, 2015 by process nmr Benchtop NMR, Chemistry, Chemometrics, Energy, NMR, PAT, Petroleum, Process NMR, qNMR, Reaction Monitoring, TD-NMR Tagged: NMR, Petroleum, RCC

Back in October we presented a talk at Gulf Coast Conference that concerned the prediction of the chemical and physical properties of heavy petroleum feeds being converted to higher value product in a residual catalytic cracker (RCC). Over the years we have analyzed these materials by 300 and 60 MHz NMR and obtained good PLS-regression models that can adequately predict properties for real-time process control and optimization in a petroleum refinery. With the advent of a large number of new benchtop NMR systems we have been convincing ourselves that these types of analyses can be performed by systems such as the Magritek Spinsolve 43 MHz. We ran a series of samples that had been sitting around our lab for 15 years by dissolving them at about 50 volume% in a 50/50 CDCl3/CS2 solvent system. For each sample we had laboratory test data for a number of chemical and physical properties of interest to process engineers. We regressed the lab data variability against the variability in the Magritek 43MHz 1H NMR spectra and obtained cross-validated PLS models. The presentation material is given here at this link – Gulf Conference Presentation – 43 MHz RCC Feedstream Regression Models

  • Go to page 1
  • Go to page 2
  • Go to page 3
  • Interim pages omitted …
  • Go to page 9
  • Go to Next Page »

Primary Sidebar

  • Home
  • About Us
    • About Process NMR
    • Our History
    • Facilities
    • Applications
    • Chemometrics
    • News and Events
  • Services
    • Price List
    • Submission Form
    • Liquid NMR
    • Solid NMR
    • Benchtop NMR
    • Consulting
    • Automated Applications
    • Expert Witness
  • Expertise
    • CV
    • Presentations
    • Reviews and White Papers
  • Blog
  • Contact

Categories

  • Beer
  • Benchtop NMR
  • Chemistry
  • Chemometrics
  • Cider
  • Craft Beverage
  • Energy
  • ESR
  • Herbal Supplement
  • IR-ATR
  • NIR
  • NMR
  • NMR Test Methods
  • NMR Validation
  • PAT
  • Petroleum
  • Process NMR
  • qNMR
  • Reaction Monitoring
  • TD-NMR
  • Uncategorized

Meta

  • Log in
  • Entries feed
  • Comments feed
  • WordPress.org

Follow Us

Follow us on social media to stay on track with the latest news.

Twitter
Facebook
RSS

Search

Blogroll

  • Carlos' NMR Software Blog
  • Mestrelab Blog – NMR Data Processing Software
  • NMR Wiki
  • Stan's NMR Blog
  • University of Ottawa – NMR Facility Blog
  • Home
  • About Us
  • Services
  • Expertise
  • Blog
  • Contact

Copyright © 2023 · Process NMR · All Rights Reserved.
Handcrafted with by Studiodog Group