1H quantitative NMR (qNMR) has been utilized to assess the the small molecule and carbohydrate chemistry of a number of home-brewed and commercial alcoholic ciders. A quantitative chemistry distribution of the products of the various fermentations that occur in cider making. Malolactic fermentation as well as fermentation by saccharomyces and wild yeasts occur in the cider making process which traditionally occurred without the intentional addition of yeast by the manufacturer. The distribution of small molecules produced by the yeast and bacterial metabolomes at work in the process can yield information of the sensory perception of ciders produced in different ways. An investigation of the residual sugar chemistry of commercial ciders gives some indication of the process of sweetening commercial cider products with sugar additions after fermentation is complete. These typical commercial ciders are very different in chemistry distribution compared to very dry cider styles such as those found in the Basque region of Spain where fermentation is taken to the extreme resulting in complete conversion of sugars to alcohol but also glycerols to 1,3 propandiol. Finally it was decided to determine how much quantitative chemistry information could be obtained from benchtop NMR systems operating in the 60 MHz range. These benchtop NMR systems have a price and cost-of-ownership that would allow small laboratories of manufacturers to think about their use in QA and QC roles.
PNA to Present 4 Topics at the 2015 ACS North East Regional Meeting
John Edwards of Process NMR Associates will be presenting 4 papers at the 2015 ACS Northeast Regional Meeting that will be held in Ithaca, NY, June 10-13, 2015.
ABSTRACT ID: 2283171
ABSTRACT TITLE: 1H qNMR of Alcoholic Cider – Analysis of Small Molecule and Residual Sugar Chemistry (final paper number: 43)
SESSION: Food Chemistry
SESSION TIME: 5:00 PM – 9:00 PM
PRESENTATION FORMAT: Poster
DAY & TIME OF PRESENTATION: Wednesday, June, 10, 2015, 5:00 PM – 9:00 PM
ROOM & LOCATION: Emerson Suites – Campus Center
ABSTRACT ID: 2283063
ABSTRACT TITLE: Nutritional Supplement and Diesel Fuel Application Development for Benchtop NMR Systems Operating at 42, 60, and 80 MHz – Equivalency with Supercon NMR (final paper number: 336)
SESSION: Analytical Chemistry
SESSION TIME: 9:00 AM – 11:30 AM
PRESENTATION FORMAT: Oral
DAY & TIME OF PRESENTATION: Friday, June, 12, 2015 from 9:45 AM – 10:05 AM
ROOM & LOCATION: 222 – Williams Hall
ABSTRACT ID: 2283105
ABSTRACT TITLE: Survey of Low Field NMR Spectrometer Platforms for Successful Screening of Sexual Enhancement and Weight Loss Supplements for Adulteration with Drugs and Drug Analogs (final paper number: 386)
SESSION: Medicinal Chemistry
SESSION TIME: 1:00 PM – 3:20 PM
PRESENTATION FORMAT: Oral
DAY & TIME OF PRESENTATION: Friday, June, 12, 2015 from 2:20 PM – 2:40 PM
ROOM & LOCATION: 302 – Williams Hall
ABSTRACT ID: 2283153
ABSTRACT TITLE: From Mash to Bottle: Chemistry of the Beer Brewing Process and NMR-based Quality Control (final paper number: 284)
SESSION: Food Chemistry
SESSION TIME: 1:30 PM – 3:10 PM
PRESENTATION FORMAT: Oral
DAY & TIME OF PRESENTATION: Thursday, June, 11, 2015 from 1:35 PM – 1:55 PM
ROOM & LOCATION: 202 – Williams Hall
Polyalphaolefin Hydrogenation – Residual Olefin Analysis – 1H NMR versus Bromine Number
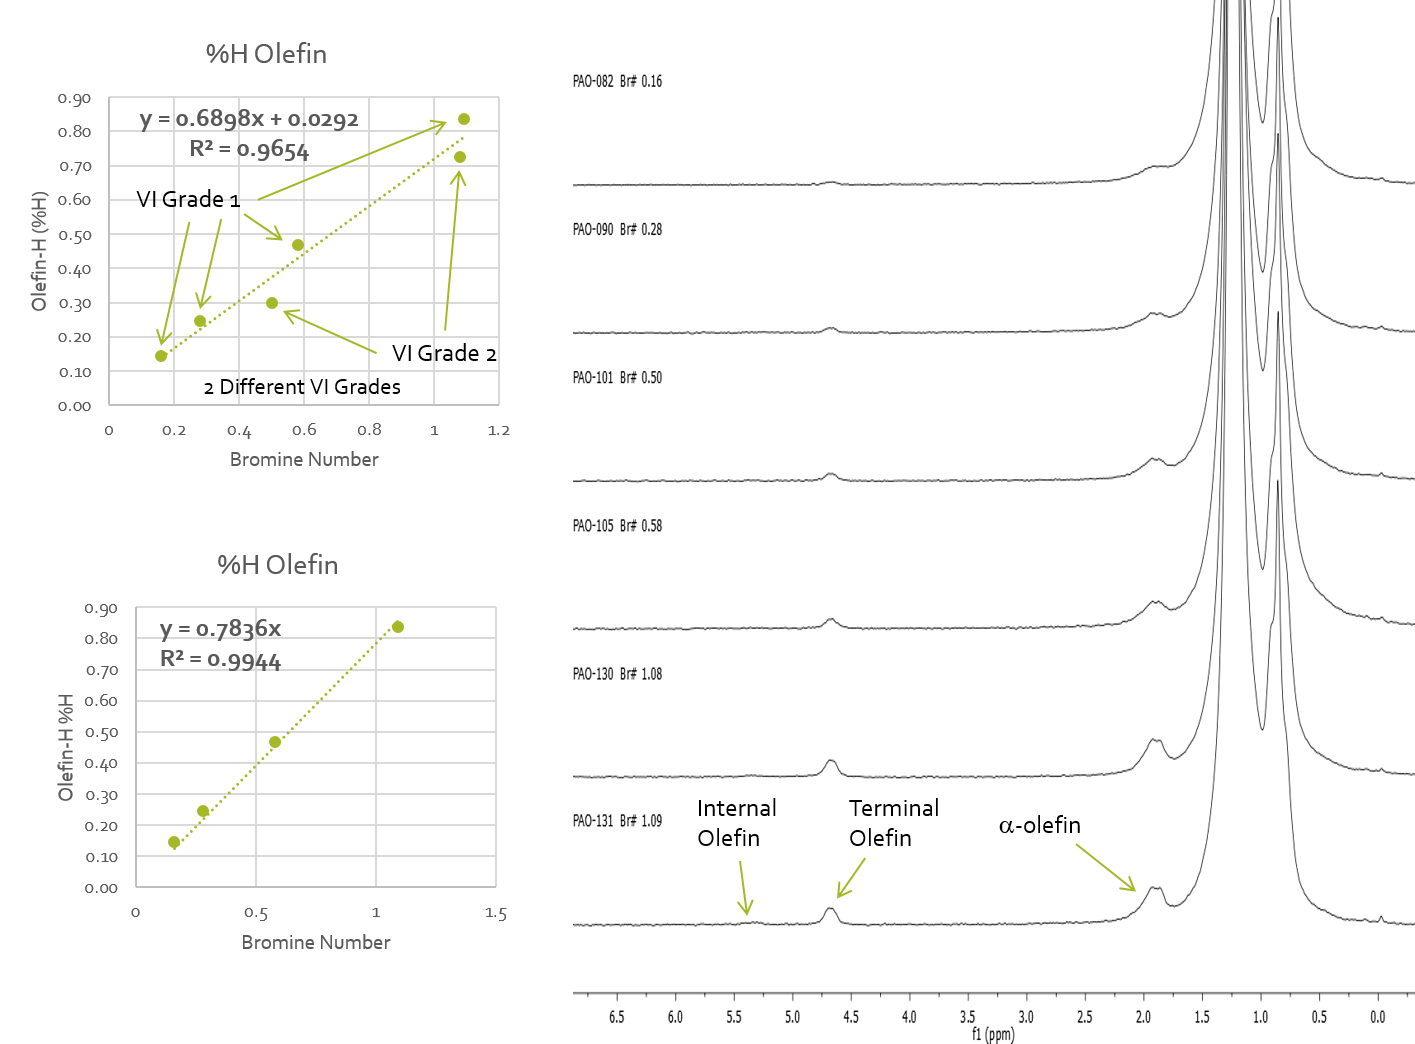
1H NMR is an excellent tool for monitoring the residual olefin content of polymers after hydrogenation reactions. The fact that the olefin fall in a unique region of the spectrum means that it is a straightforward measurement to quantify the %H present as olefin or to correlate that olefin content with other analyses such as bromine number. Here is an example of a polyalphaolefin residual olefin analysis. The olefin proton content (%H) was plotted against bromine number values obtained on each of the samples. A linear correlation was obtain but two different correlations were observed that were dependent on the viscosity index of the polyalphaolefin being analyzed. Figure 1 shows the 1H NMR spectra obtained on neat samples on a Picospin-80 spectrometer operating at 82.3 MHz. The methyl and methlene protons of the polymer backbone are plainly seen and the olefin and alpha-olefin protons are observed.
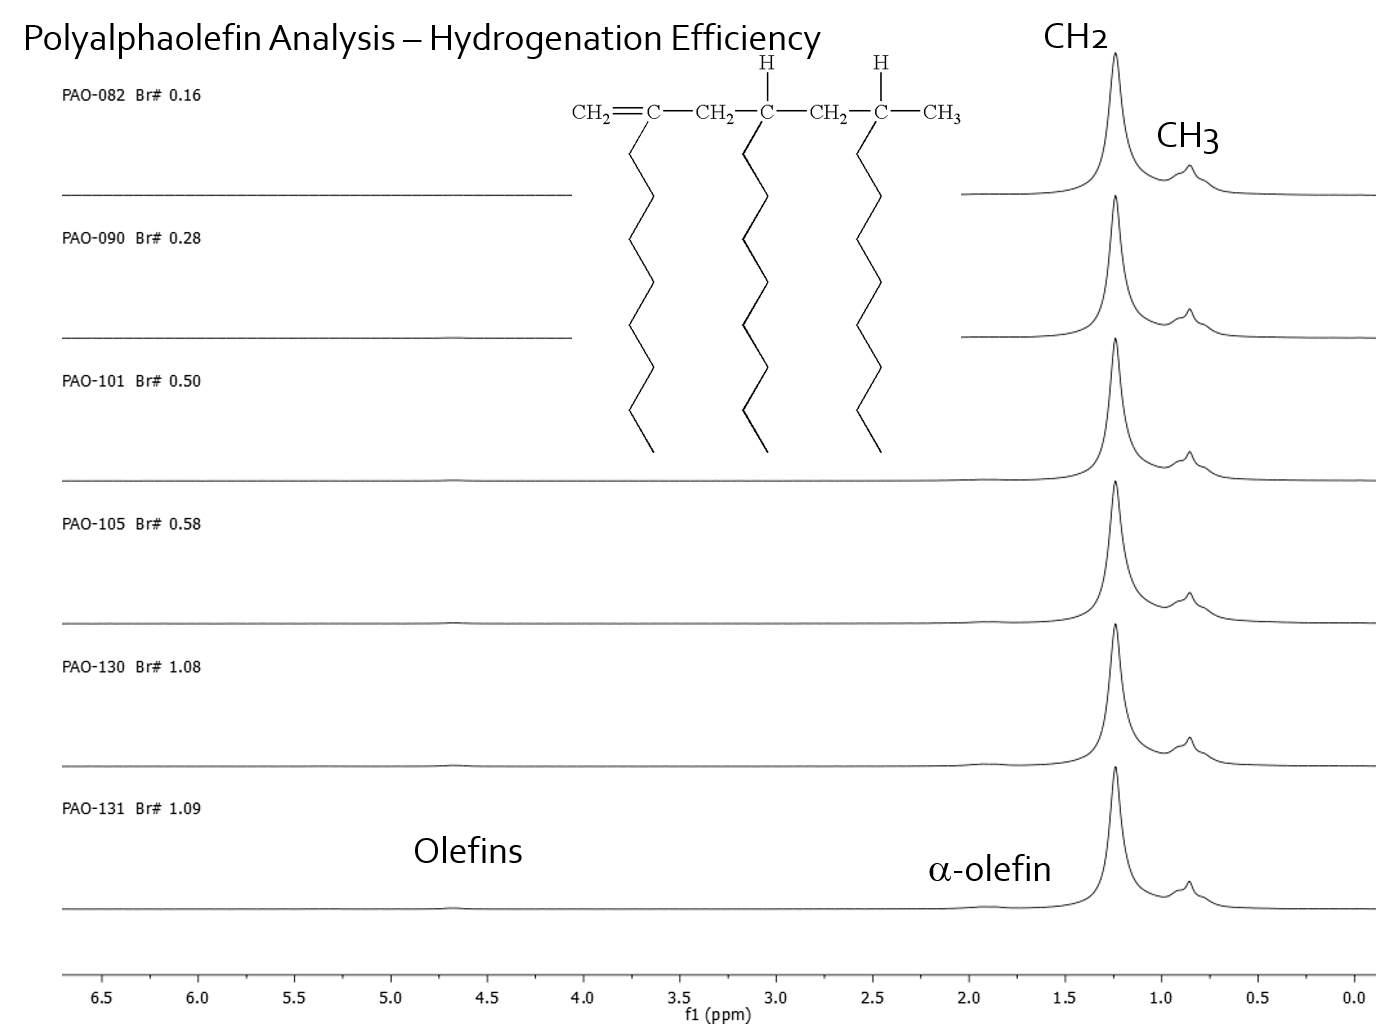
Figure 2 shows the linear correlation between %H olefin and bromine number with the two correlations caused by different VI grade being indicated. The analysis shows that for the two viscosity grades the grade can be identified from the linear correlation that the data falls onto and the %H olefins content can directly yield the bromine number. This NMR method provides an alternative to the following ASTM standards: D1159 Test Method for Bromine Numbers of Petroleum Distillates and Commercial Aliphatic Olefins by Electrometric Titration D1491 Test Method for Test for Bromine Index of Aromatic Hydrocarbons by Potentiometric Titration D1492 Standard Test Method for Bromine Index of Aromatic Hydrocarbons by Coulometric Titration D2710 Test Method for Bromine Index of Petroleum Hydrocarbons by Electrometric Titration D5776 Test Method for Bromine Index of Aromatic Hydrocarbons by Electrometric Titration
NMR Detection of Tomato Paste Spoilage in 1000 Liter Metal Lined Totes
Poster to be Presented at the 56th ENC, Asilomar CA, April 2015
| NMR Detection of Tomato Paste Spoilage in 1,000 L, Metal Lined Totes |
| Michele Martin1; Paul Giammatteo2; Michael McCarthy1; Matthew Augustine1 |
| 1University of California, Davis, Davis, California; 2Process NMR Associates, Danbury, CT |
| Abstract Low field nuclear magnetic resonance (NMR) is used as a non-invasive method for detecting spoiled tomato paste. It is shown that the 1H T1 and T2 relaxation times change as tomato paste spoils due to changes in viscosity and/or changes in the concentration of paramagnetic compounds. With the goal of developing a spoilage detector that can be used in a tomato processing facility, a γBo = 19.5 MHz single-sided handheld NMR instrument is used. Due to the dominance of diffusion on relaxation measurements made with the single sided instrument, the slope of the amplitude of a spin echo for three different delay times is used to provide a viscosity dependent parameter that permits the differentiation between pristine and spoiled tomatoes. 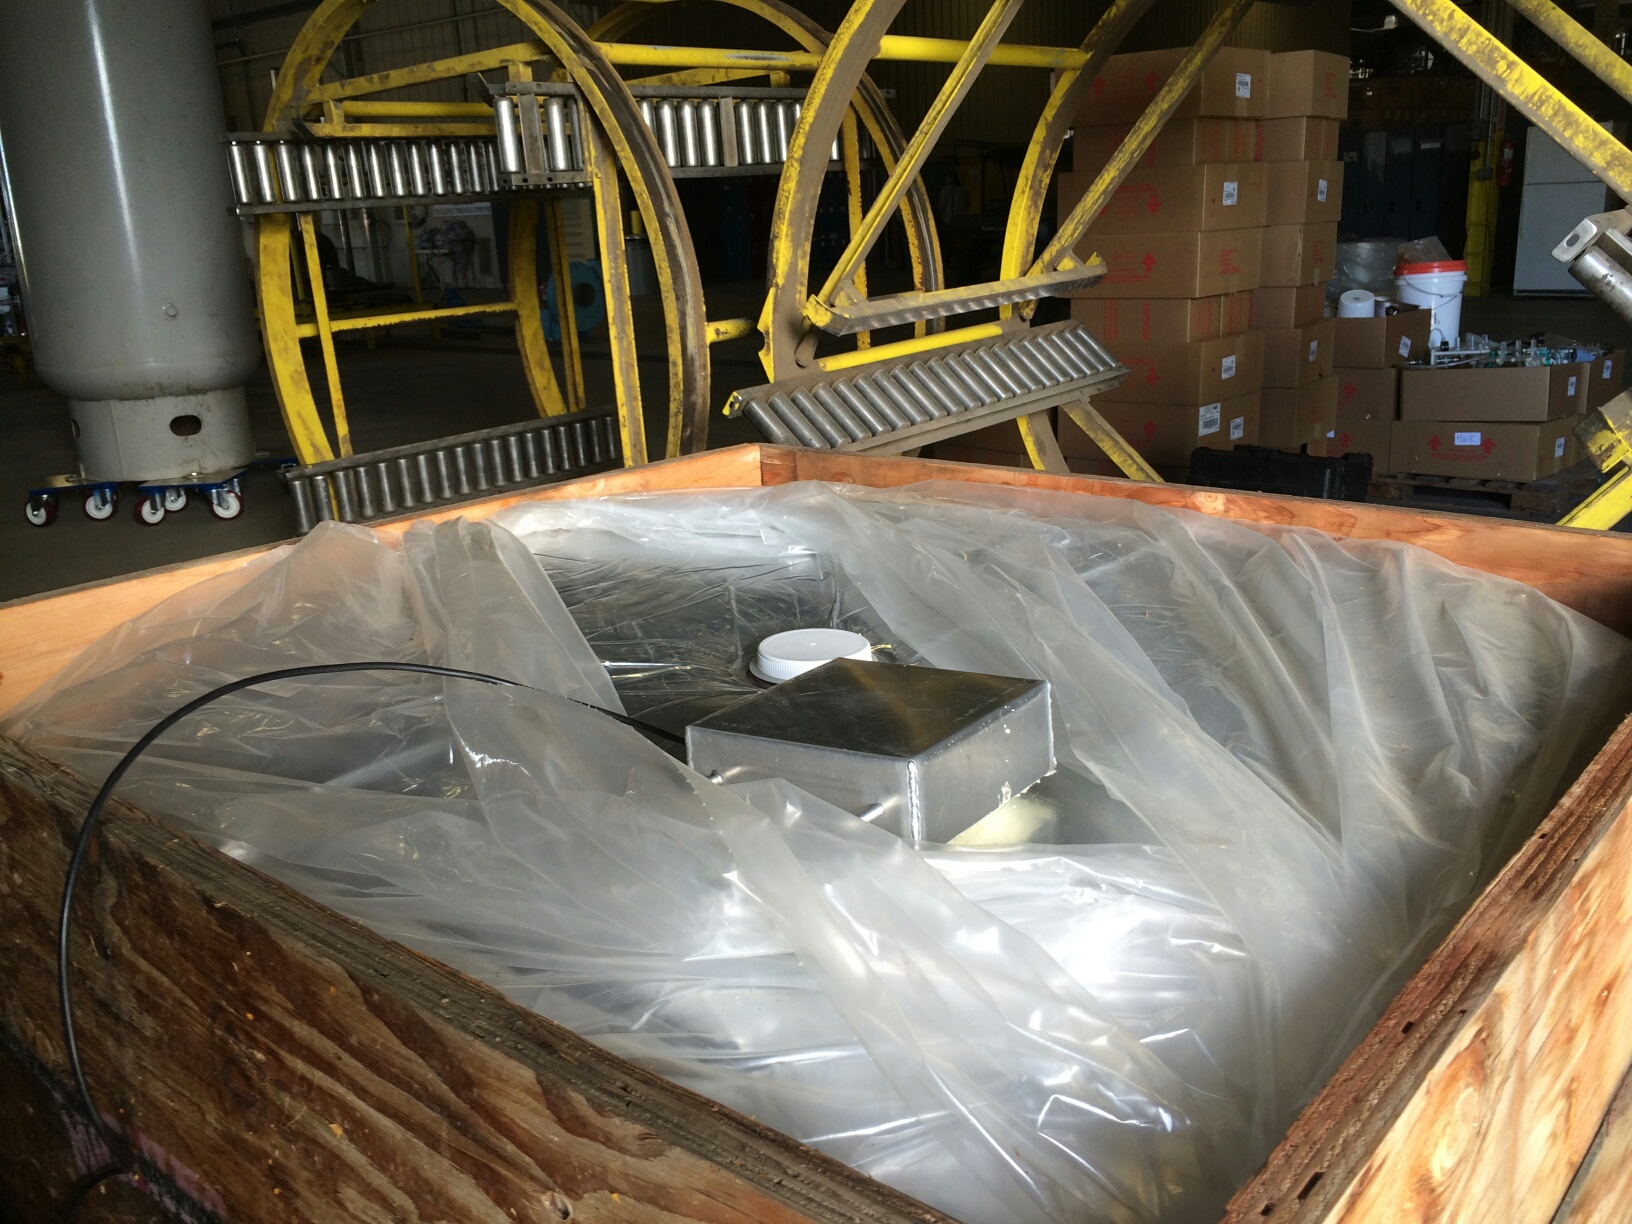 |
One-Sided NMR – Non-Invasive Analysis of Tomato Paste
Residual Catalytic Cracker – Heavy Petroleum Feedstream Properties from 1H NMR at 43 MHz
Back in October we presented a talk at Gulf Coast Conference that concerned the prediction of the chemical and physical properties of heavy petroleum feeds being converted to higher value product in a residual catalytic cracker (RCC). Over the years we have analyzed these materials by 300 and 60 MHz NMR and obtained good PLS-regression models that can adequately predict properties for real-time process control and optimization in a petroleum refinery. With the advent of a large number of new benchtop NMR systems we have been convincing ourselves that these types of analyses can be performed by systems such as the Magritek Spinsolve 43 MHz. We ran a series of samples that had been sitting around our lab for 15 years by dissolving them at about 50 volume% in a 50/50 CDCl3/CS2 solvent system. For each sample we had laboratory test data for a number of chemical and physical properties of interest to process engineers. We regressed the lab data variability against the variability in the Magritek 43MHz 1H NMR spectra and obtained cross-validated PLS models. The presentation material is given here at this link – Gulf Conference Presentation – 43 MHz RCC Feedstream Regression Models