• Skip to main content
  • Skip to primary sidebar

NMR Testing Laboratory

Industrial NMR Spectroscopy Applications

  • Home
  • About Us
    • About Process NMR
    • Our History
    • Facilities
    • Applications
    • Chemometrics
    • News and Events
  • Services
    • Price List
    • Submission Form
    • Liquid NMR
    • Solid NMR
    • Benchtop NMR
    • Consulting
    • Automated Applications
    • Expert Witness
  • Expertise
    • CV
    • Presentations
    • Reviews and White Papers
  • Blog
  • Contact
You are here: Home / Archives for qNMR

PANIC NMR Validation Group – Website, Meetings and Organization

June 18, 2015 by process nmr Benchtop NMR, NMR, NMR Test Methods, NMR Validation, PAT, Process NMR, qNMR, TD-NMR

Validation of NMR: No Need to PANIC – Workshop held February 13, 2015, La Jolla, CA, U.S.A

In conjunction with the 3rd PANIC conference in La Jolla, California, a 1-day NMR validation workshop was held that attracted approximately 80 interested participants. The agenda of the meeting is provided at this link (http://www.nmrvalidation.org/index.php/events/event-review) and registered participants can now download the presentations presented at the meeting. At the meeting it was decided to proceed with the idea of founding an organization dedicated to the development of validate NMR methods for use throughout all industry sectors.

Organizational Scope:

NMR spectroscopy provides a means to evaluate material with high compound and high material specificity. Information as to the chemical structure, stereochemistry, quantity, material composition, and material identity is encoded in the NMR spectrum. The high reproducibility of NMR spectroscopy from instrument to instrument and lab to lab makes NMR an excellent tool for material validation. Approaches to utilizing NMR as a material validation tool include using (1) targeted approaches, the identification and quantification of specific components, and (2) non-targeted approaches, the use of chemometric methods to evaluate the spectrum as a whole. Efforts to increase the number and the speed of validated NMR methods are underway. This promises to move NMR technology from R&D to a mainstream analytical tool for production leading to high quality product assessment.

Quantitative NMR spectroscopy (qNMR) provides the most universally applicable form of direct purity determination without the need for reference materials of analytes or the calculation of response factors, with the only requirement being the exhibition of suitable NMR spectral properties. Due to recent advances in the technical development of NMR instruments, such as acquisition electronics and probe design, detection limits of components in liquid mixtures have been improved into the lower ppm range (approx. 5–10 ppm amount of substance).

The development of validated procedures and qualified standards will give users the tools to routinely exploit qNMR and enable them to speed up analytical method development, with the added advantage of reducing the time and financial burden of multiple analytical testing.

Over the last few years a number of efforts have been made to include NMR in routine testing and analysis – especially in regulated fields such as those operating under GMP or GLP guidelines. Unfortunately it has been observed that approval authorities, standard method organizations, and auditors prefer to take analytical routes derived from classical chromatographic methods. Since NMR represents a direct comparison analysis method such decisions clearly fail to take advantage of the benefits that NMR can provide.

The PANIC validation group proposes to become a driving force in getting NMR methods validated, publicized, and supported by documentation and qualified standards. The organization will also provide a mechanism for repeatability/reproducibility assessment of NMR methods as well as the round-robin accreditation of NMR labs. We aim to proactively promote the technology and improve its acceptance by the analytical community across all industry sectors.

What we want:

  • Identify a network of NMR people concerned with validation that can ultimately assist each other through the validation process.
  • Harmonize the terminology and a standard approach for NMR validations.
  • Position the guidelines produced by consensus of the NMR community so that accreditation agencies can use this process.

It is expected that there will be an annual 1-day meeting in conjunction with future PANIC conferences. A website has been been created as an organizational repository. The website can be found here: http://www.nmrvalidation.org/index.php and details of future events and, eventually, contact information will be provided.

1H qNMR of Alcoholic Cider – Analysis of Small Molecule and Residual Sugar Chemistry

June 8, 2015 by process nmr Beer, Benchtop NMR, Chemistry, Cider, NMR, qNMR

1H quantitative NMR (qNMR) has been utilized to assess the the small molecule and carbohydrate chemistry of a number of home-brewed and commercial alcoholic ciders. A quantitative chemistry distribution of the products of the various fermentations that occur in cider making. Malolactic fermentation as well as fermentation by saccharomyces and wild yeasts occur in the cider making process which traditionally occurred without the intentional addition of yeast by the manufacturer. The distribution of small molecules produced by the yeast and bacterial metabolomes at work in the process can yield information of the sensory perception of ciders produced in different ways. An investigation of the residual sugar chemistry of commercial ciders gives some indication of the process of sweetening commercial cider products with sugar additions after fermentation is complete. These typical commercial ciders are very different in chemistry distribution compared to very dry cider styles such as those found in the Basque region of Spain where fermentation is taken to the extreme resulting in complete conversion of sugars to alcohol but also glycerols to 1,3 propandiol. Finally it was decided to determine how much quantitative chemistry information could be obtained from benchtop NMR systems operating in the 60 MHz range. These benchtop NMR systems have a price and cost-of-ownership that would allow small laboratories of manufacturers to think about their use in QA and QC roles.

1H qNMR analysis of molecular components in hard cider – targeted and non-targeted quantitative chemical analysis

PNA to Present 4 Topics at the 2015 ACS North East Regional Meeting

May 17, 2015 by process nmr Beer, Benchtop NMR, Chemometrics, Cider, Energy, Herbal Supplement, NMR, PAT, Petroleum, qNMR

John Edwards of Process NMR Associates will be presenting 4 papers at the 2015 ACS Northeast Regional Meeting that will be held in Ithaca, NY, June 10-13, 2015.

ABSTRACT ID: 2283171
ABSTRACT TITLE: 1H qNMR of Alcoholic Cider – Analysis of Small Molecule and Residual Sugar Chemistry (final paper number: 43)
SESSION: Food Chemistry
SESSION TIME: 5:00 PM – 9:00 PM
PRESENTATION FORMAT: Poster
DAY & TIME OF PRESENTATION: Wednesday, June, 10, 2015, 5:00 PM – 9:00 PM
ROOM & LOCATION: Emerson Suites – Campus Center

ABSTRACT ID: 2283063
ABSTRACT TITLE: Nutritional Supplement and Diesel Fuel Application Development for Benchtop NMR Systems Operating at 42, 60, and 80 MHz – Equivalency with Supercon NMR (final paper number: 336)
SESSION: Analytical Chemistry
SESSION TIME: 9:00 AM – 11:30 AM
PRESENTATION FORMAT: Oral
DAY & TIME OF PRESENTATION: Friday, June, 12, 2015 from 9:45 AM – 10:05 AM
ROOM & LOCATION: 222 – Williams Hall

ABSTRACT ID: 2283105
ABSTRACT TITLE: Survey of Low Field NMR Spectrometer Platforms for Successful Screening of Sexual Enhancement and Weight Loss Supplements for Adulteration with Drugs and Drug Analogs (final paper number: 386)
SESSION: Medicinal Chemistry
SESSION TIME: 1:00 PM – 3:20 PM
PRESENTATION FORMAT: Oral
DAY & TIME OF PRESENTATION: Friday, June, 12, 2015 from 2:20 PM – 2:40 PM
ROOM & LOCATION: 302 – Williams Hall

ABSTRACT ID: 2283153
ABSTRACT TITLE: From Mash to Bottle: Chemistry of the Beer Brewing Process and NMR-based Quality Control (final paper number: 284)
SESSION: Food Chemistry
SESSION TIME: 1:30 PM – 3:10 PM
PRESENTATION FORMAT: Oral
DAY & TIME OF PRESENTATION: Thursday, June, 11, 2015 from 1:35 PM – 1:55 PM
ROOM & LOCATION: 202 – Williams Hall

Essential Oil Analysis – Comparison of 1H NMR from Benchtop and Supercon NMR Systems

March 8, 2015 by process nmr Benchtop NMR, Chemistry, qNMR

1H NMR shows excellent promise to be utilized in the quality control and authentication of essential oils. In order to ascertain if benchtop NMR systems reveal adequate “1H spectral fingerprints” for this purpose we have run several hundred essential oils at 300 MHz (Varian Mercury-300 MVX by 1H, 13C, COSY, HETCOR, DEPT)  as well as at 82.3 MHz (Picospin 80), 60 MHz (Aspect-60), and 42.5 MHz (Magritek Spinsolve). The results plainly show that the spectrometers all yield similar proton line-widths with the difference in field strength leading to different levels of spectral dispersion and resolution. Though each spectrum is different it can plainly be seen that they all contain the same information with varying degrees of overlap. Chemometric and database comparative methods are being developed to allow identification of various essential oils as well as screening and quantifying different levels of adulteration. The figures below show examples from 6 different essential oils showing spectra obtained from all 4 spectrometers and plotted in the normalized chemical shift scale (ppm) as well as the absolute frequency scale (Hz).EO1 EO2 EO3 EO4 EO5 EO6 EO7 EO8 EO9 EO10 EO11 EO12

Polyalphaolefin Hydrogenation – Residual Olefin Analysis – 1H NMR versus Bromine Number

March 8, 2015 by process nmr Benchtop NMR, NMR, PAT, Petroleum, Process NMR, qNMR, Reaction Monitoring

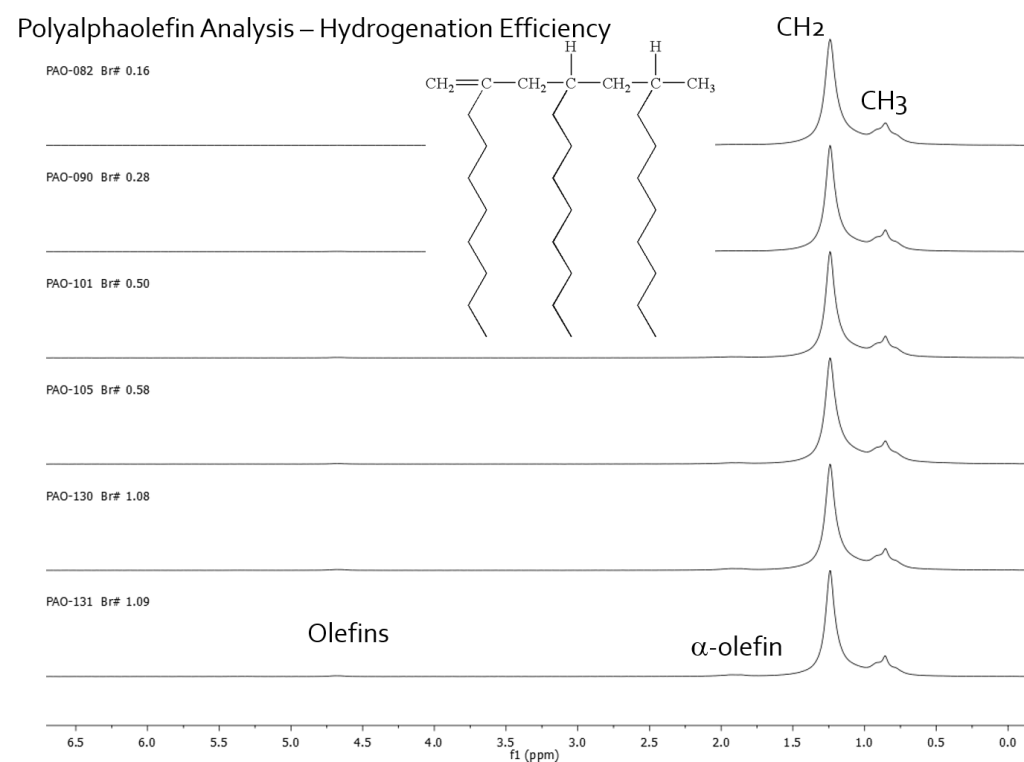
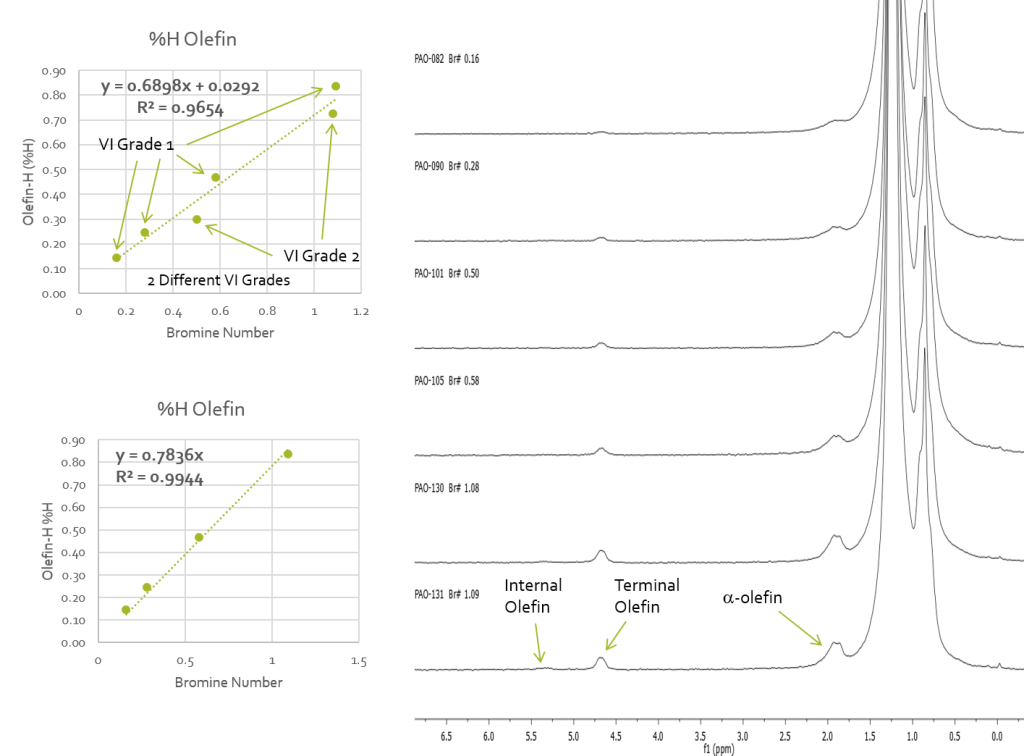
1H NMR is an excellent tool for monitoring the residual olefin content of polymers after hydrogenation reactions. The fact that the olefin fall in a unique region of the spectrum means that it is a straightforward measurement to quantify the %H present as olefin or to correlate that olefin content with other analyses such as bromine number. Here is an example of a polyalphaolefin residual olefin analysis. The olefin proton content (%H) was plotted against bromine number values obtained on each of the samples. A linear correlation was obtain but two different correlations were observed that were dependent on the viscosity index of the polyalphaolefin being analyzed. Figure 1 shows the 1H NMR spectra obtained on neat samples on a Picospin-80 spectrometer operating at 82.3 MHz. The methyl and methlene protons of the polymer backbone are plainly seen and the olefin and alpha-olefin protons are observed.

1H NMR - Polyalphaolefins - Residual Olefin Analysis
Figure 1: 1H NMR – Polyalphaolefins – Residual Olefin Analysis


Figure 2 shows the linear correlation between %H olefin and bromine number with the two correlations caused by different VI grade being indicated. The analysis shows that for the two viscosity grades the grade can be identified from the linear correlation that the data falls onto and the %H olefins content can directly yield the bromine number. This NMR method provides an alternative to the following ASTM standards:                                                            D1159 Test Method for Bromine Numbers of Petroleum Distillates and Commercial Aliphatic Olefins by Electrometric Titration                                      D1491 Test Method for Test for Bromine Index of Aromatic Hydrocarbons by Potentiometric Titration                                                                         D1492  Standard Test Method for Bromine Index of Aromatic Hydrocarbons by Coulometric Titration                                                                             D2710 Test Method for Bromine Index of Petroleum Hydrocarbons by Electrometric Titration                                                                                      D5776 Test Method for Bromine Index of Aromatic Hydrocarbons by Electrometric Titration

Correlation of Olefin Content obtained by 1H NMR with Bromine Number in Polyalphaolefins
Figure 2: Correlation of Olefin Content obtained by 1H NMR with Bromine Number in Polyalphaolefins
  • « Go to Previous Page
  • Page 1
  • Page 2
  • Page 3
  • Page 4
  • Interim pages omitted …
  • Page 6
  • Go to Next Page »

Primary Sidebar

  • Home
  • About Us
    • About Process NMR
    • Our History
    • Facilities
    • Applications
    • Chemometrics
    • News and Events
  • Services
    • Price List
    • Submission Form
    • Liquid NMR
    • Solid NMR
    • Benchtop NMR
    • Consulting
    • Automated Applications
    • Expert Witness
  • Expertise
    • CV
    • Presentations
    • Reviews and White Papers
  • Blog
  • Contact

Categories

  • Beer
  • Benchtop NMR
  • Chemistry
  • Chemometrics
  • Cider
  • Craft Beverage
  • Energy
  • ESR
  • Herbal Supplement
  • IR-ATR
  • NIR
  • NMR
  • NMR Test Methods
  • NMR Validation
  • PAT
  • Petroleum
  • Process NMR
  • qNMR
  • Reaction Monitoring
  • TD-NMR
  • Uncategorized

Meta

  • Log in
  • Entries feed
  • Comments feed
  • WordPress.org

Follow Us

Follow us on social media to stay on track with the latest news.

Twitter
Facebook
RSS

Search

Blogroll

  • Carlos' NMR Software Blog
  • Mestrelab Blog – NMR Data Processing Software
  • NMR Wiki
  • Stan's NMR Blog
  • University of Ottawa – NMR Facility Blog
  • Home
  • About Us
  • Services
  • Expertise
  • Blog
  • Contact

Copyright © 2025 · Process NMR · All Rights Reserved.
Handcrafted with by Studiodog Group