60 MHz 1H NMR Reaction Monitoring
Visualization and Quantitation with MestReNova Software
MestreNova NMR post-processing software from MestreLab Research SRL has been a big improvement on our ability to rapidly process real time reaction data obtained on our AspectItalia 60 MHz NMR system.
Reaction System: Acetylation of t-butyl alcohol with acetic anhydride in the presence of acid.
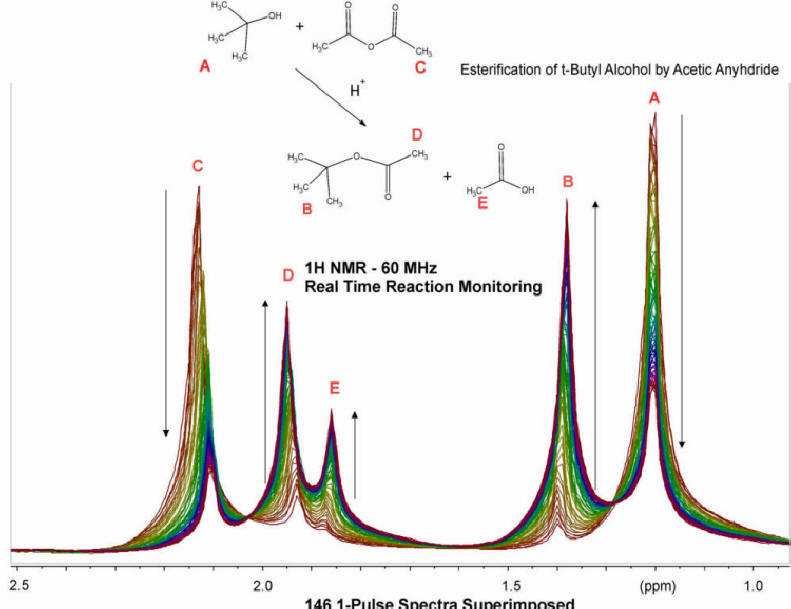
Figure 1: Stacked Plot of the Aliphatic Region of the Spectrum 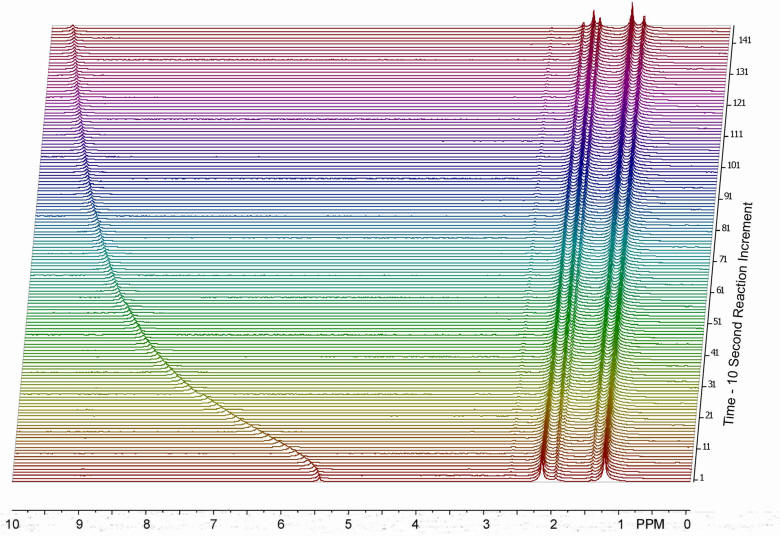
Figure 2: Stacked Plot – Full Spectrum – Reaction Monitoring – 146 Spectra – 10 Seconds Apart 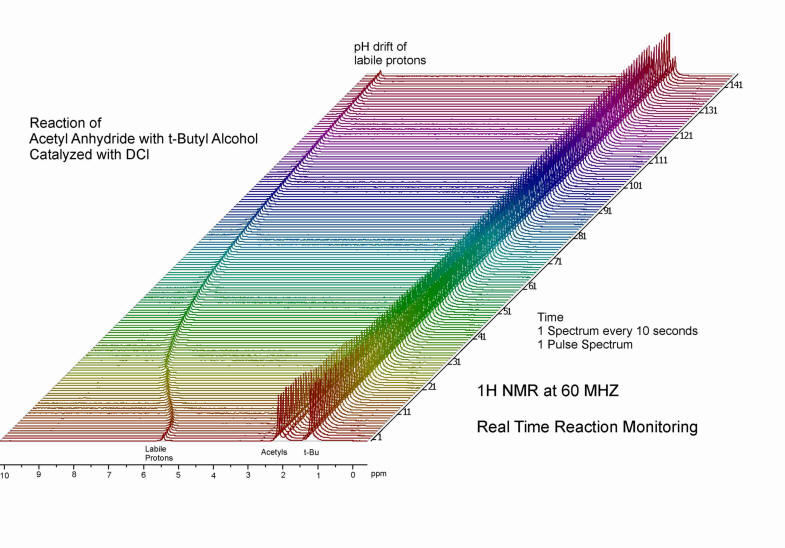
Figure 3: Angled Stack Plot – Acetic Anhydride and tert-Butanol – Real Time Reaction Monitoring by 1H NMR at 60 MHz
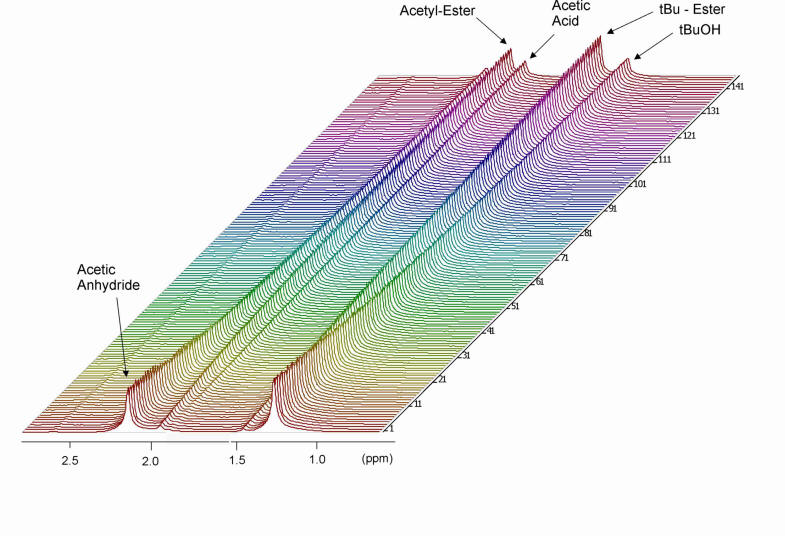
Figure 4: Stacked and Whitewashed Plot of 1H NMR data at 60 MHz – Real Time Reaction Monitoring of Acetic Anhydride with tert-Butanol 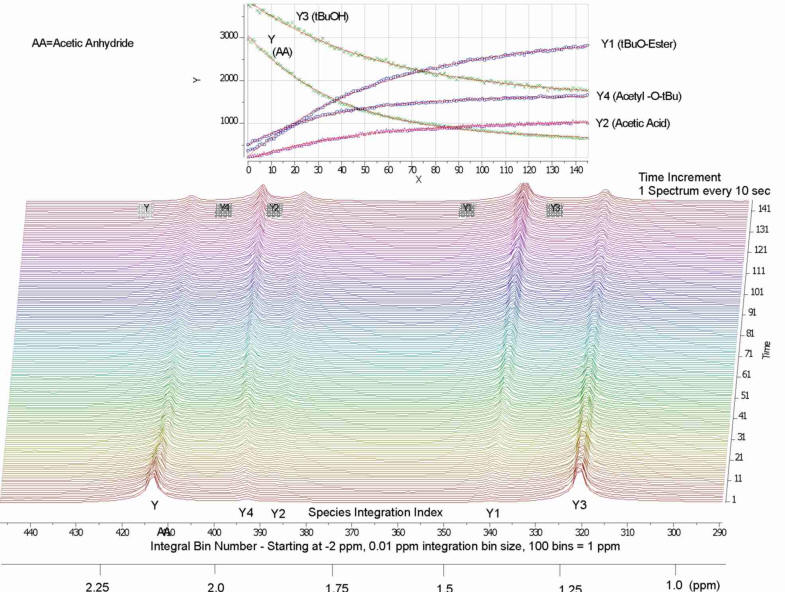
The MNova data analysis tools allow the user to integrate NMR reaction peaks and automatically plots and fits them to exponential time constants allowing detailed kinetics to be extracted rapidly and easily from the data. What used to take hours of lining up ascii spectra in excel or other software now literally takes seconds. The integration is segmented in such a manner that integrals can be made to track with shifting resonances, for example labile protons effected by pH.