Quantifiying Adulteration of Licorice with Maltodextrin by Liquid & Solid State NMR
PDF Version- AppNote – Spectra
Three samples were analyzed to determine to determine if liquid or solid-state NMR techniques could be utilized to quanitfy adulteration of licorice powders by matlodextrin. Samples analyzed were:
Samples: Matltodextrin, Licorice #1, Licorice #2
Licorice #1 and Licorice #2 were analyzed by a combination of liquid state 1H and 13C NMR on a Varian Unity-300 spectrometer, and solid state 13C NMR on a Varian UnityPlus 200 spectrometer. The resulting spectra are shown in the attached plots.
One of the Licorice samples is adulterated by maltodextrin to an unknown concentration, the other licorice sample is pure licorice. Which sample was which was not known during the analysis. Initially it was hoped that the addition of maltodextrin to the licorice would be readily observed as new peaks appearing in the spectrum of the licorice sample. However, it can be seen that in both the 1H and 13C NMR there is considerable overlap of the peaks in the spectra of pure licorice and maltodextrin.
When no observable maltodextrin peaks could be assigned it was decided to simply use the quantitative integral data from the regions of the spectrum where the maltodextrin overlaps with the licorice spectrum compared to the integrals obtained from regions solely assignable to licorice. In Tables 1-3 are the quantitative results for each of the experiments performed.
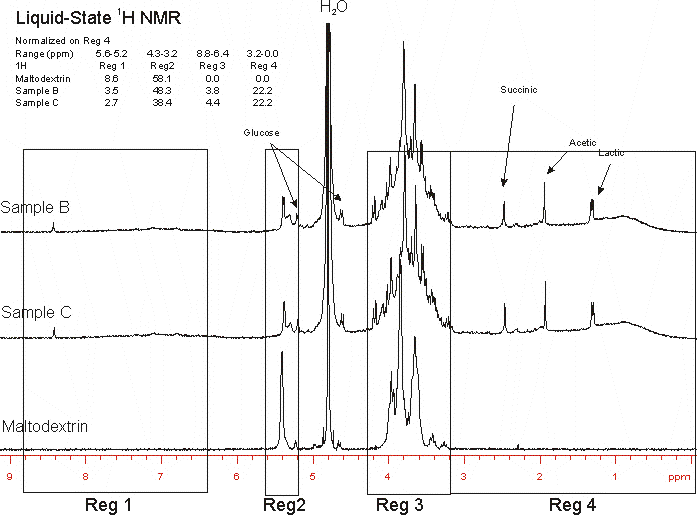
Table 1: 1H NMR Integral Regions
Normalized on Reg 4
| Range (ppm) | 5.6-5.2 | 4.3-3.2 | 8.8-6.4 | 3.2-0.0 |
| 1 H | Reg 1 | Reg 2 | Reg 3 | Reg 4 |
| Maltodextrin | 8.6 | 58.1 | 0.0 | 0.0 |
| Sample #1 | 3.5 | 48.3 | 3.8 | 22.2 |
| Sample #2 | 2.7 | 38.4 | 4.0 | 22.2 |
| Sample #1 | 10.2 | 71.2 | 13.3 | 22.2 |
| Sample #2 | 6.9 | 64.6 | 9.0 | 22.2 |
Regions 1 and 2 contain maltodextrin/licorice peaks.
Regions 3 and 4 contain only licorice peaks. Data was normalized to region 4. The normalization normalizes the licorice signal intensity. Thus the increased intensity of regions 1 and 2 in Sample #1 is indicative that this sample contains maltodextrin. samples #1+ and #2+ were made by adding more maltodextrin to the samples. Sample #1+ contains a further 10.9 wt% maltodextrin, while Sample #2 contains 11.4 wt% maltodextrin. The values were used to calculate the maltodextrin content in sample #1.
The 1H analysis indicates that there is 3.3 wt% maltodextrin in Sample#1.
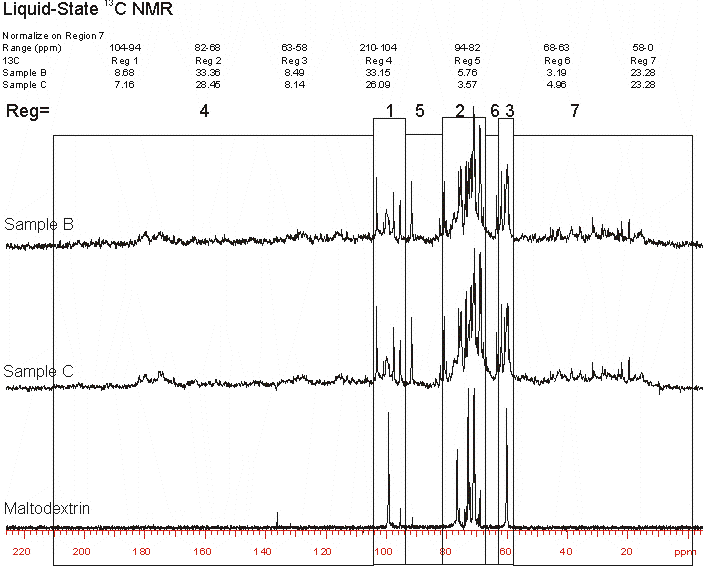
Table 2: <sup13< sup=””>C NMR Integral Regions
Normalize on Region 7
| Range (ppm) | 104-94 | 82-68 | 63-58 | 210-104 | 94-82 | 68-63 | 58-0 |
| 13C | Reg 1 | Reg 2 | Reg 3 | Reg 4 | Reg 5 | Reg 6 | Reg7 |
| Sample #1 | 8.68 | 33.36 | 8.49 | 33.15 | 5.76 | 3.19 | 23.28 |
| Sample #2 | 7.16 | 28.45 | 8.14 | 26.09 | 3.57 | 4.96 | 23.28 |
| Sample #1+ | 9.98 | 39.42 | 10.53 | 29.70 | 4.54 | 4.54 | 23.28 |
| Sample #2+ | 8.66 | 35.46 | 10.16 | 22.89 | 3.16 | 5.32 | 23.28 |
Regions 1-3 were common to licorice and maltodextrin signals, while regions 4-7 were exclusive to licorice signals. Normalization on region 7 sets licorice at a normalized intensity. Again the intensity of regions 1-3 increases from Sample #2 to Sample #1 indicating the precence of maltodextrin in Sample #1
Calculation indicates that there is 6.1 wt% maltodextrin in the sample.
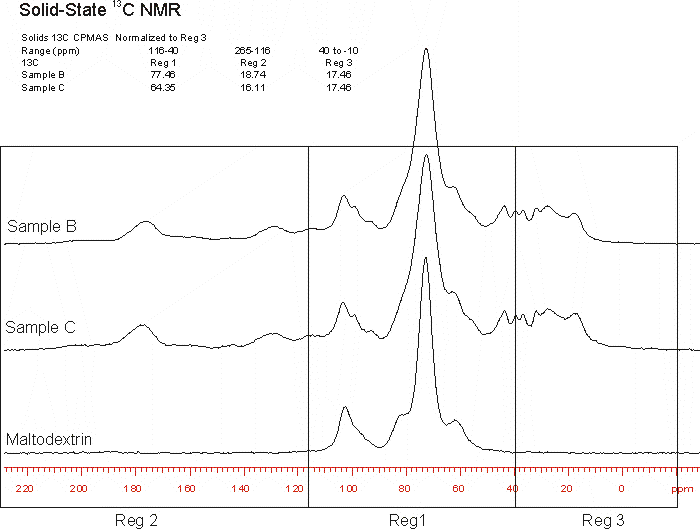
Table 3: Solid-State 13C Integral Regions
| Solids 13C CPMAS | |||
| Normalized to Reg 3 | |||
| Range (ppm) | 116-40 | 265-116 | 40-10 |
| 13C | Reg 1 | Reg 2 | Reg 3 |
| Sample #1 | 77.46 | 18.74 | 17.46 |
| Sample #2 | 64.35 | 16.11 | 17.46 |
Region 1 contains maltodextrin and licorice signals, while regions 2 and 3 contain only licorice signals.
Again, the intensity of region 1 increases from Sample #2 to 31 upon normalization of the licorice only region 3. This confirms the presence of maltodextrin in Sample #1. Samples #2+ and #1+ were not analyyzed by solida-state NMR.
This 13C analysis is much faster than the liquid-state NMR and would be a plausible short cut to quanitfy maltodextrin content. Upon completion of the analysis it was revealed that the adulteration value was 5% maltodextrin.